
The (temporary) breach of the 3% level in 10-year rates, corporate earnings, the weakness in emerging markets, the recent bounce in the USD and the potential easing of geopolitical tensions are all driving the news flow. Here are some observations from last week:
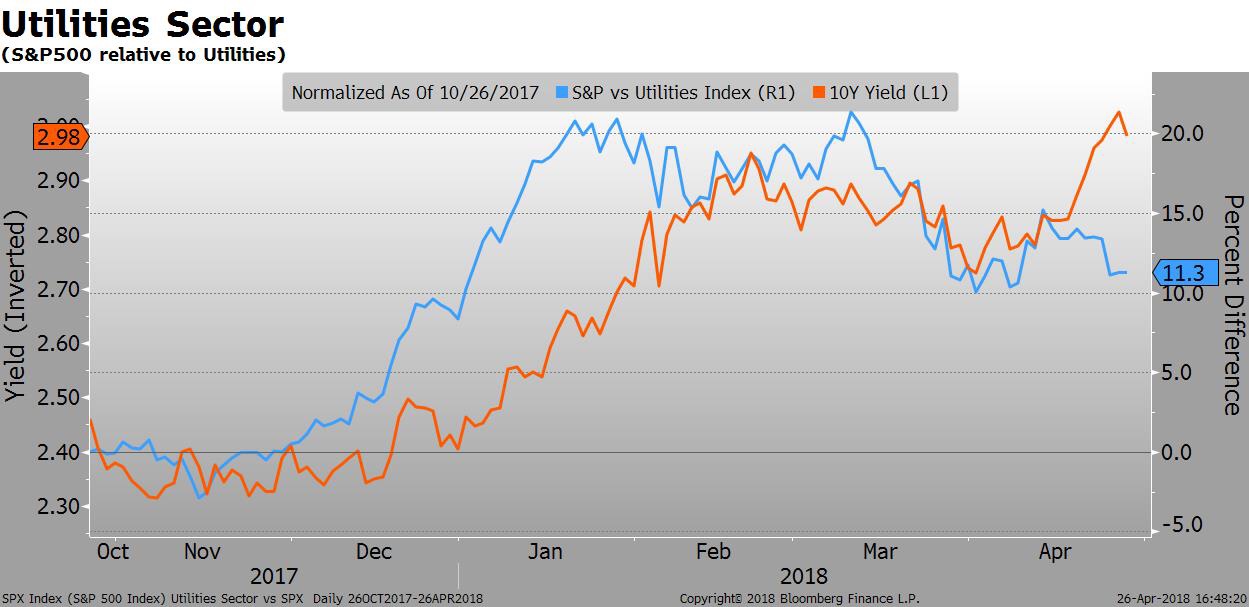
There is usually a pretty tight correlation between interest rates and stocks of interest rate sensitive sectors such as Utilities and REITS. There was an interesting divergence last week: Utility stocks outperformed the broader market by 2% in the same week the 10Y note reached a new cycle high with the breach of the psychologically important 3% level.
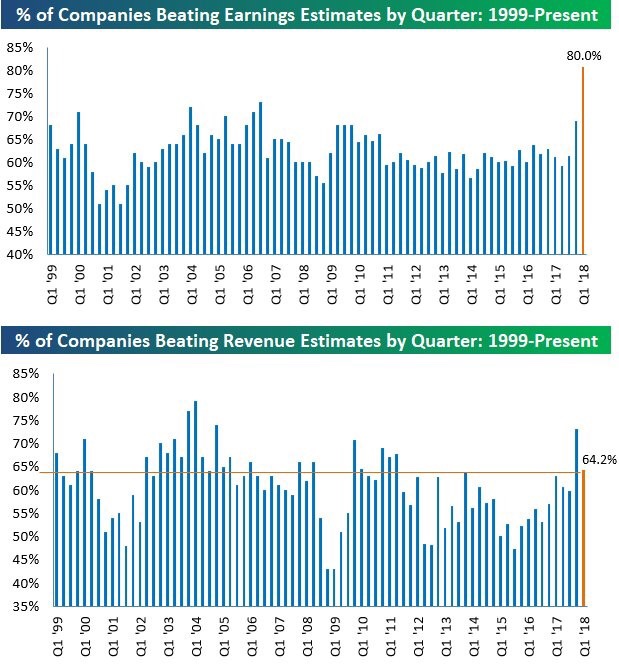
Fundamentally, earnings are coming in very strong. More than 50% of the S%P has reported so far this quarter, and most companies are beating expectations. Tax reform is providing a one-time boost, but the strength of the global economy is also supportive (revenue growth is exceeding estimates, too). With the broader market close to unchanged on the year and earnings growth running at such high levels, the valuation of the equity market is slowly correcting back to reasonable levels. The forward P/E ratio is around 16x: right on top of the 25-year average.
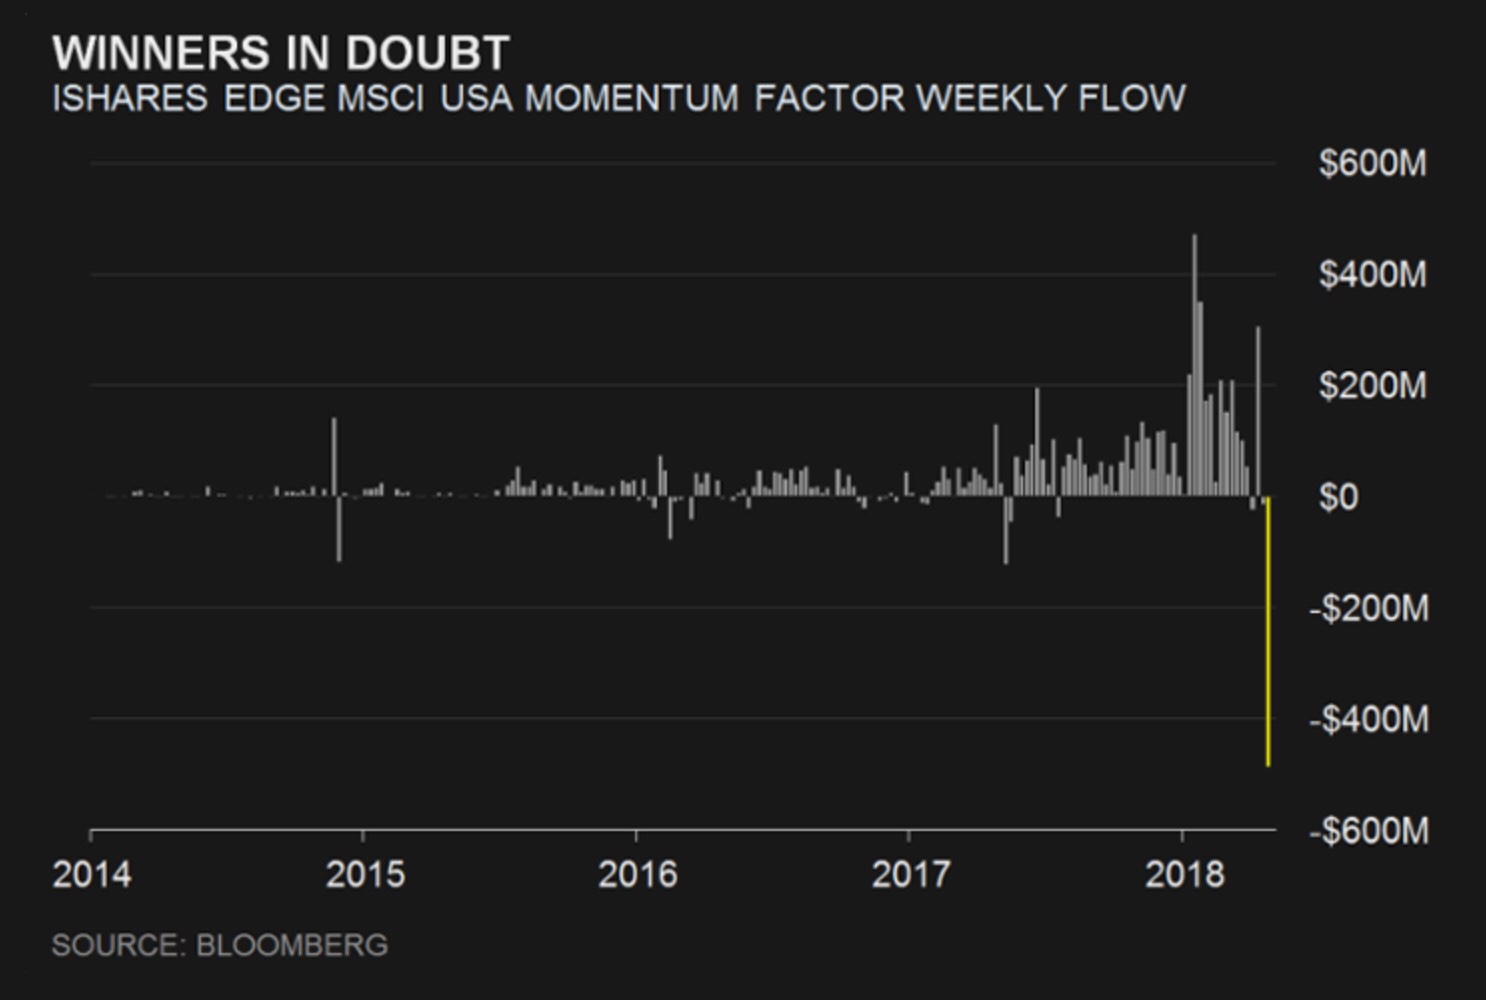
Momentum stocks powered the market in 2017 and in the first month of 2018. The Tech sector, in particular, provided strong leadership. That is beginning to change. While it is only one data point, the iShares Momentum Factor ETF (MTUM) experienced its largest weekly outflow ever. Investor flows in and out of the momentum factor contribute to its performance- both on the way up AND down. Stay alert!
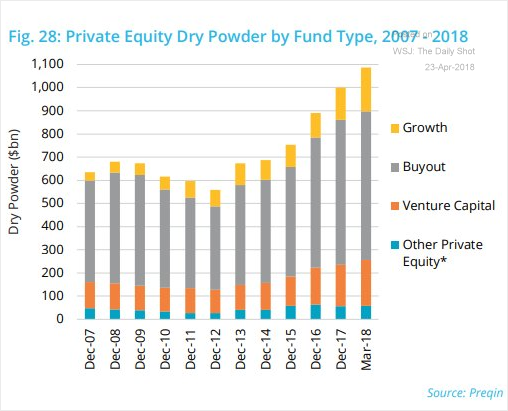
The private equity war chest gives us a glimpse into the investment cycle. One notable sign is the massive amount of available capital at the large private equity firms. There is over $1 trillion waiting on the sidelines, ready to go to work. These firms are driving up private valuations and lowering prospective returns for LPs in the process.
Fixed income ETF flows last week were negative for risk assets and positive for US Treasuries. The largest outflows were in high yield (HYG and JNK, emerging market bonds (EMB) and bank loans (BKLN). These five ETFs saw over $1.8 billion of outflows. US Treasury ETFs (TLT, IEF, and SHV) saw an inflow of $1.7 billion. This explains some of the weakness in the cash high yield market this week.

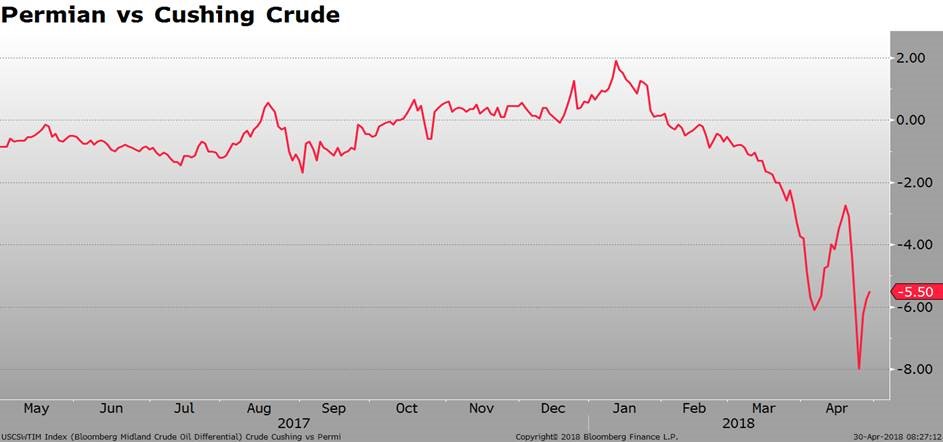
What is the price of oil? Well, it depends on where it comes from. The difference between Brent and WTI is well publicized, and more observers are tracking the price differential between Western Select and WTI. There is also the spread between WTI priced in Midland, Texas, where most of the oil coming from the Permian Basin goes, and WTI priced in Cushing, Oklahoma, where crude from the Midwest and Gulf Coast is priced. High production in the Permian Basis has created a bottleneck in transportation to Midland. The result is a lower price for Permian oil relative to other parts of the country. New pipelines scheduled for completion next year should alleviate the situation.
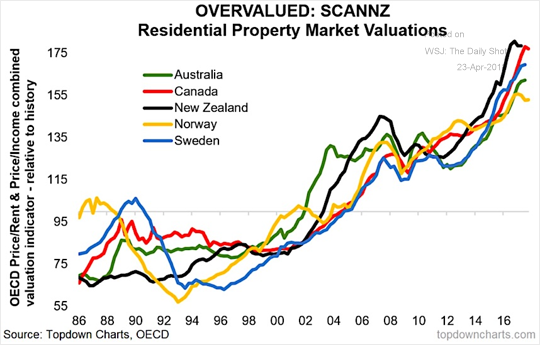
If we move into an era of increasing global term premiums and higher long-term rates, global property markets could be in trouble. Which ones? Let’s start by looking at the ones that are the most over-valued. The property markets with the highest Price/Rent and Price/Income ratios are the most vulnerable.