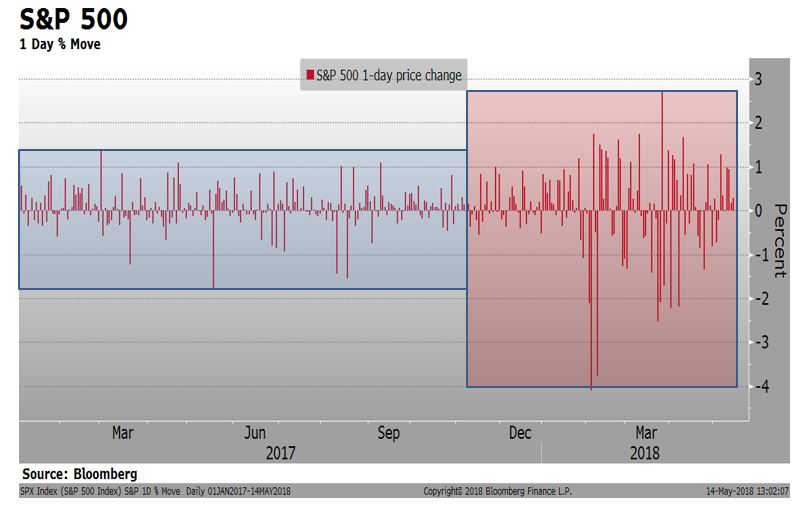
There is a lot going on these days in the world of geopolitics and economics. Iran, US bond yields, oil prices, global economic deceleration, cracks in emerging markets: the list of concerns grows by the week. So far, at least, the uncertainty is being channeled through the equity market.
Daily changes in the S&P so far in 2018 are much larger than they were in 2017. Realized current 100-day volatility is 18.1% compared to 6.8% at the end of 2017- almost a three-fold increase.
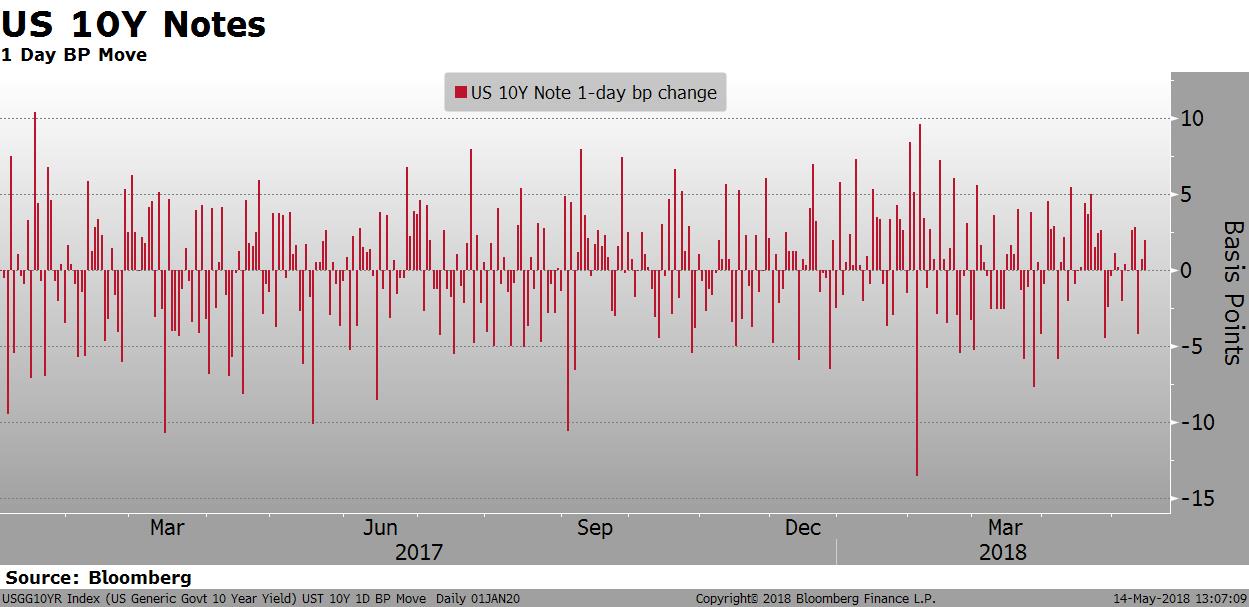
The same can’t be said for the bond market. Realized daily volatility in 2018 in the interest rate market looks pretty similar to 2017.
Another key difference in today’s equity market compared to 2017 is investor sentiment. It’s amazing what 12 straight months of positive returns did to the psyche. Coming into the year, investors were overly optimistic, with 66% of the respondents in the weekly AAII survey indicating a bullish stance. Today, that number has shrunk to 28%. The number of bears has increased from 16% to 30%. Market sentiment is better balanced now.

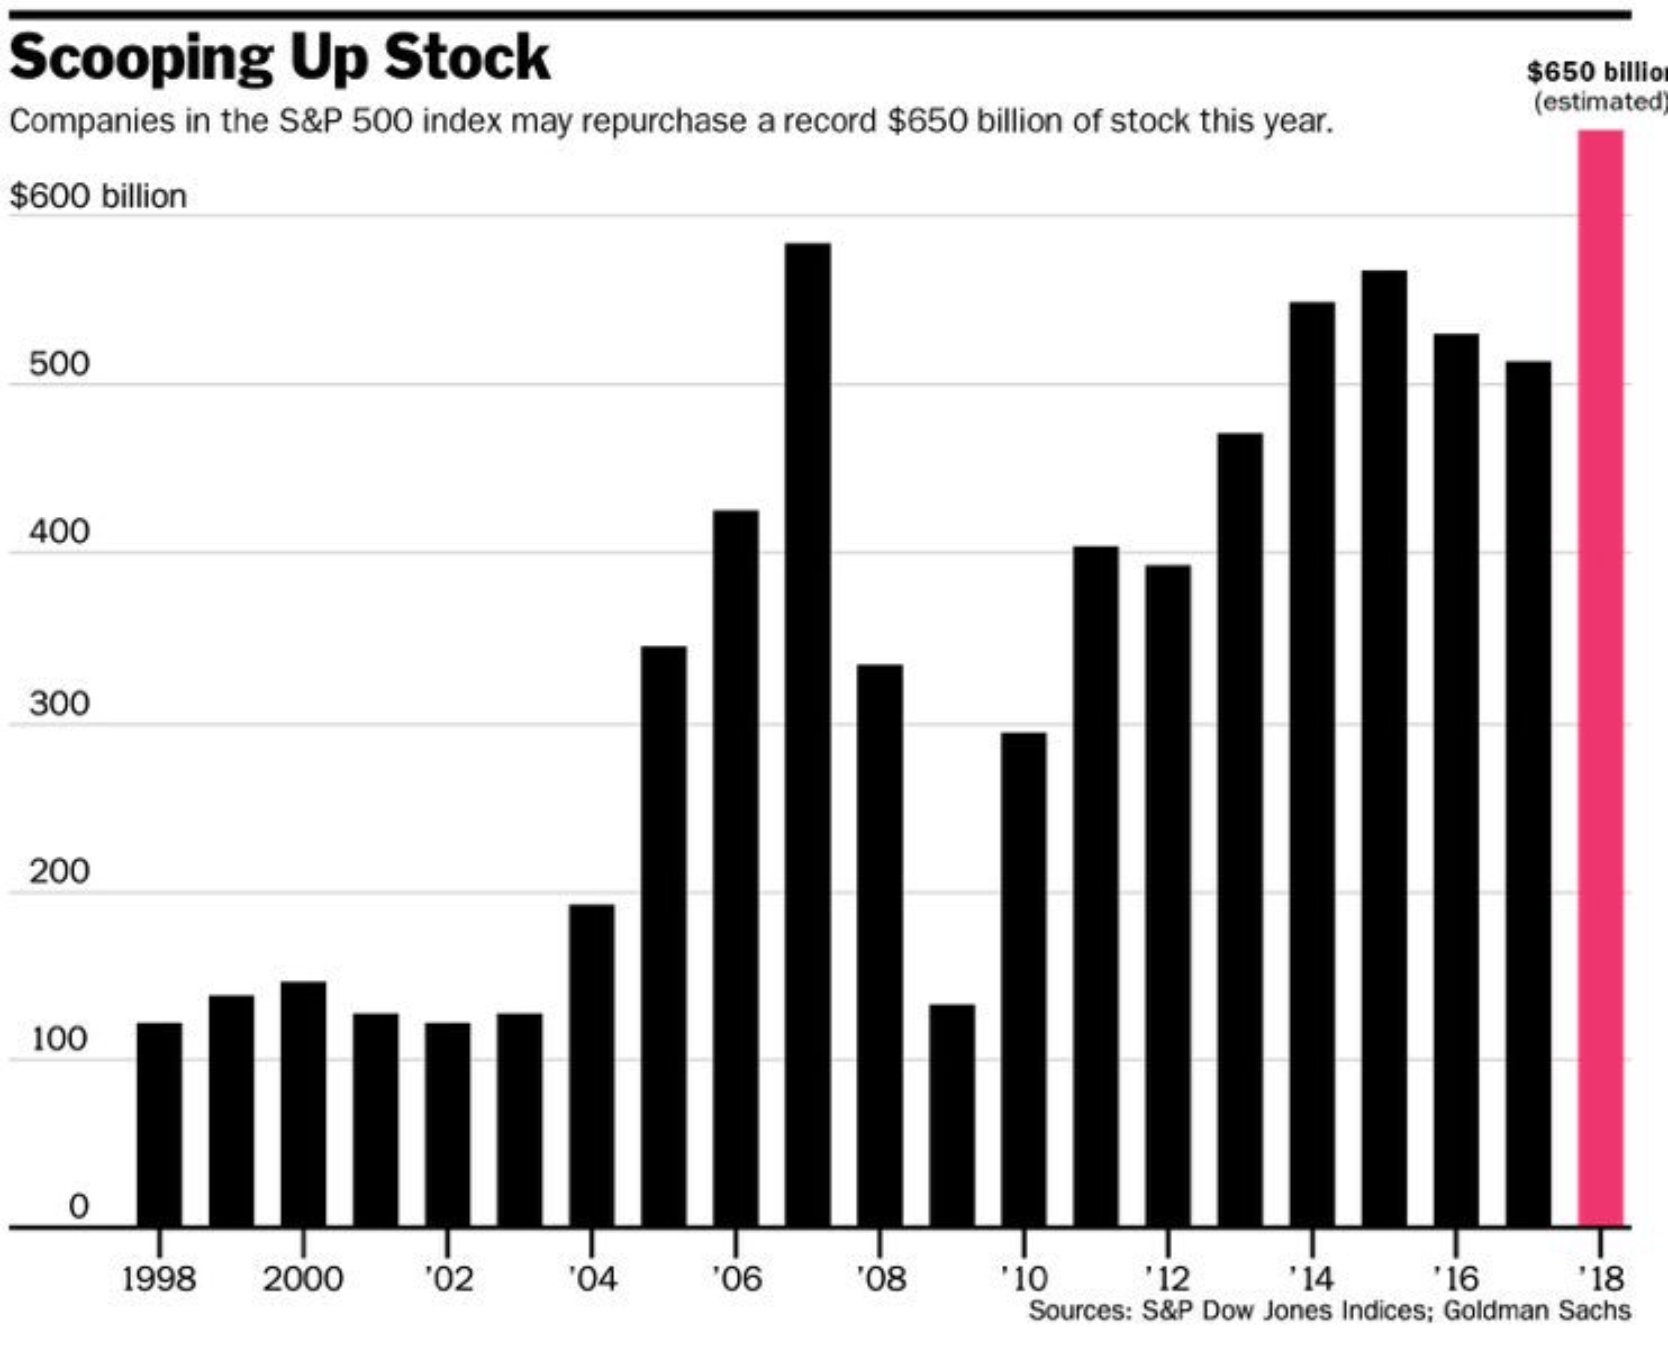
The excitement over tax reform understandably contributed to the January euphoria. One of the potential outcomes of the new policy was a resumption of corporate capital spending. Capital investment this cycle has been lower than in previous economic cycles, despite the abundance of cheap debt capital. Based on recent activity and statements from Q1 earnings season, it appears the international companies with “excess” overseas cash plan to use at least a portion of the money to facilitate share buybacks rather than make additional investments.
Estimated 2018 share buybacks to the tune of $650 billion amount to an incremental yield of 2.9% ($650B/Market cap of $2.56 trillion) for the S&P 500. The 2.9% buyback yield on top of the roughly 2% dividend yield makes the equity market a little more competitive in a rising bond yield environment.
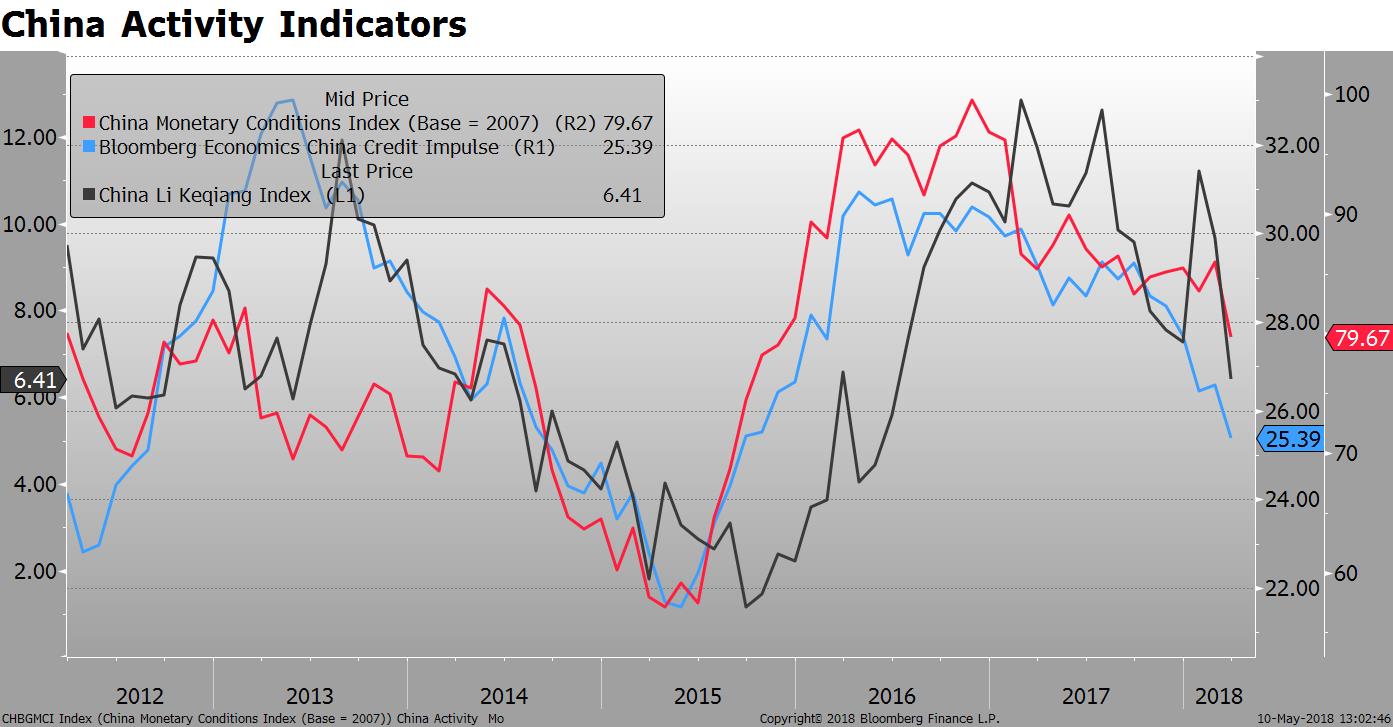
The headline Q1 economic data is lower than anticipated, especially in Europe. In China, some indicators are also showing some weakness.
The Li Keqiang Index takes a weighted average of annual growth rates
in outstanding bank loans (40%), electricity production 40%), and rail freight volume. The Bloomberg China Credit Impulse tracks new credit as a percentage of GDP. The China Monetary Conditions Index is an index that follows monetary conditions in China, with weights of 60% for real interest rate, 15% for the real effective exchange rate, and 25% for total loan growth. All three indicators began to turn lower in 2017 and have continued lower in 2018.
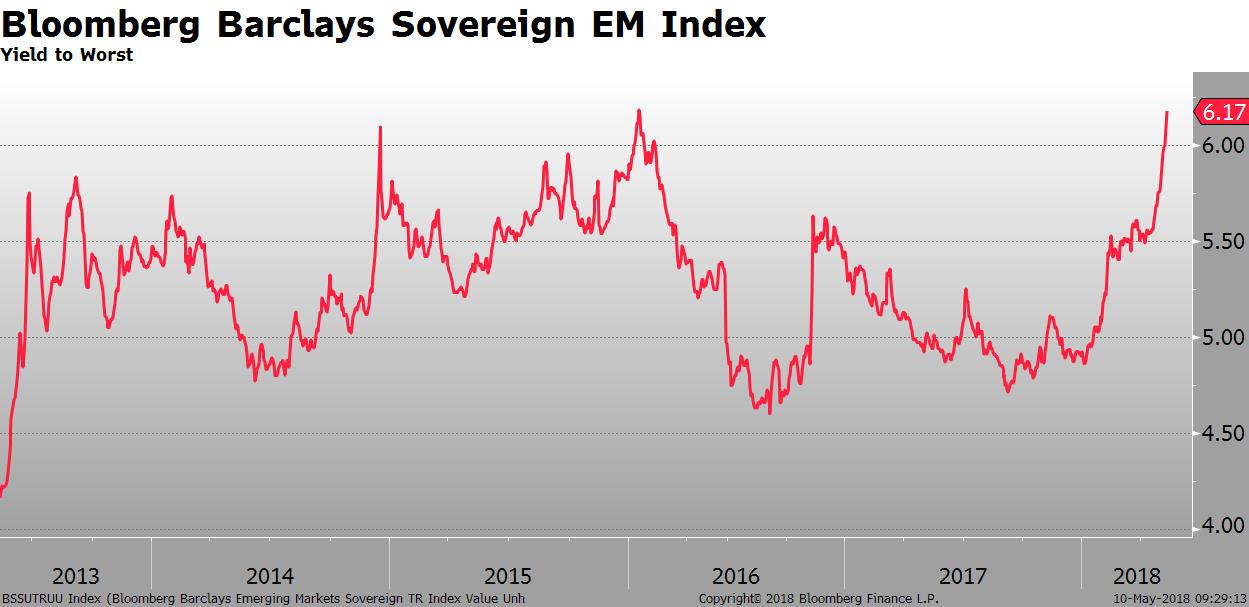
One of the surprising stories of the year is the strength of the USD given the move higher in both short-term and long-term interest rates. The stronger dollar and higher rates have hurt the bonds of emerging market USD issuers. The yield on the Bloomberg Barclays Sovereign EM Index rose to 6.17% last week, the highest level since the beginning of 2016. The yield of the index was 4.8% at the start of the year.
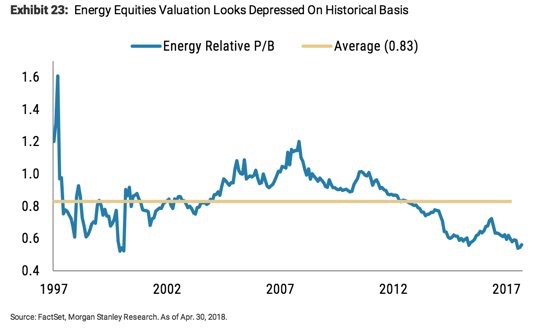
Another surprise to many has been the change in outlook for crude oil prices. With Brent crude approaching $80/barrel and WTI over $71/barrel, the energy sector will receive a welcome boost to cash flow. The stock market valuation of energy companies, however, is just beginning to materialize. The sector still trades at a large discount to the broader market.
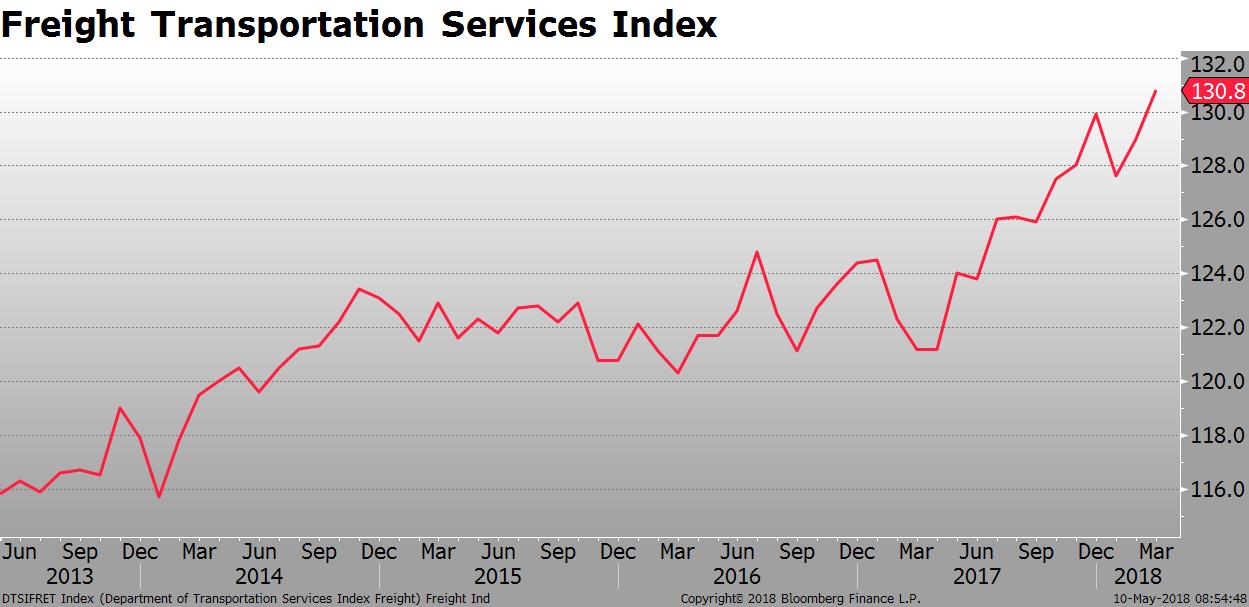
The Freight Transportation Services Index, commonly abbreviated as TSI, is a measure of the volume of services that are performed by the transportation sector. This Index covers the number of activities in the freight carriers and passenger carriers. When the accelerations and decelerations of the Freight TSI are compared to the growth cycles of the economy, declines in the index led decelerations in the growth cycle. At the moment, the index is not predicting a slowdown in economic activity.
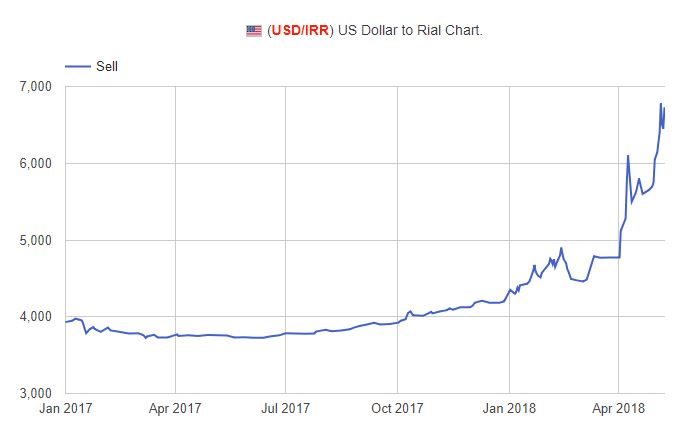
The reintroduction of sanctions on Iran added fuel to the weakening of the Iranian currency that began earlier this year. The Rial has lost over 50% of its value vs. the USD in the last 6 months. Further weakening may cause domestic political unrest in Iran, an outcome that would not disappoint the US government. Given the Iranian currency is not actively traded in the market, we have to look at black market prices to figure out what is happening. The chart below comes from bonbast.com.
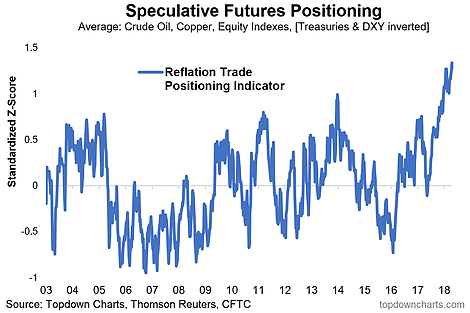
The rise in energy and metals prices, combined with the sell-off in bonds and USD strength, are drawing more attention to the “reflation” theme across markets. According to a TopDown Charts, positioning in these markets is at an extreme. The average standardized positioning across crude oil, copper, US equity indexes, treasuries & DXY shows high confidence in the reflation trade.