

It’s hard to lose money investing in short-dated investment grade bonds. By short-dated investment grade I mean Treasuries, Agency mortgage-backed securities and high-quality corporate bonds with 1-3 years left until maturity. The default risk is low and the interest rate risk, or bond price volatility, is small due to the low duration. That said, 2018 is shaping up to be the worst year for this category of bonds in the last 25 years.
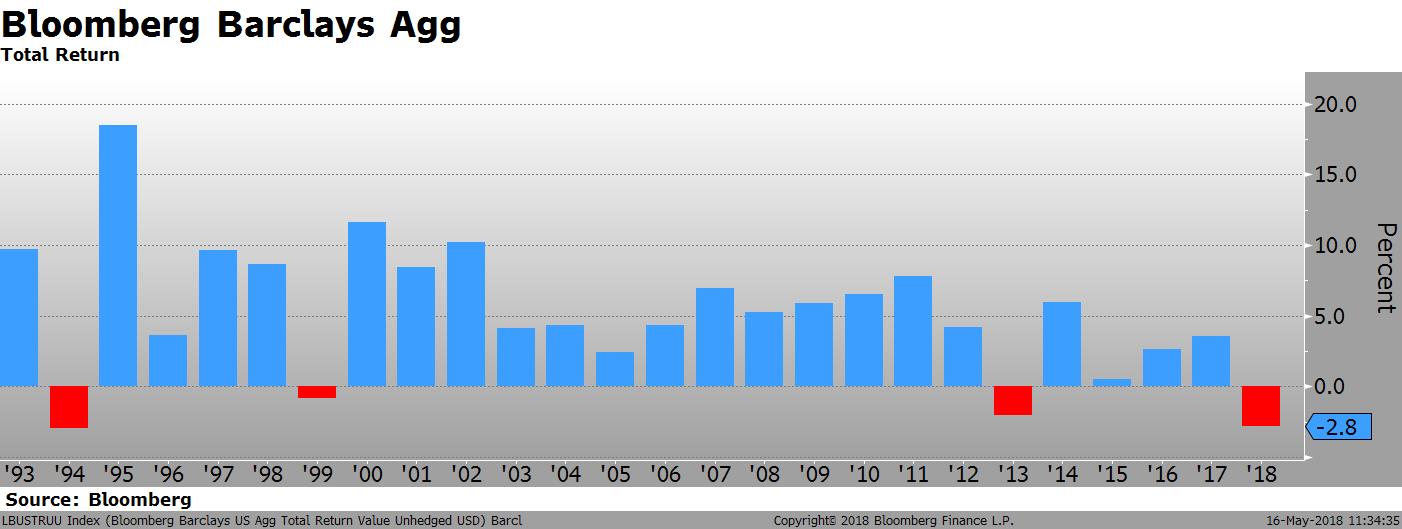
Year to date, the return on Bloomberg Barclays Aggregate Index is -2.8%, the worst since 1994 and only one of four down years in the last quarter century. The total return for the 1-3 year subcomponent of the index is also negative so far in 2018. Up until this point, the short duration bucket if this index had not generated a negative annual total return over that same time 25-year time period. Not in 1994 when 2-year rates rose 350 bp and not in 2004 when the Fed raised interest rates 325 bp. How is that possible?

The total return for a bond over any period of time is generated from a combination of two components: the coupons received and the change in the price of the bond. Except in the case of floating rate bonds, the coupon is fixed at the time of issuance and remains the same until the bond matures. Think of the coupon, or yield, as your “carry”. Price changes in the value of the bond happen when interest rates move up or down after the bond is issued. Think of price changes as your “performance”. [Note: bond prices move in the opposite direction of yield changes. That is, when market yields increase the future cashflows from the bond are discounted to a greater degree and thus the sum of the present value of these cashflows is reduced.]
When I started trading bonds in the mid-1990’s, a mentor gave me some valuable advice. The front end of the curve is all about carry; the back end is about performance. In other words, when investing in short-dated bonds, carry is the most critical factor in your trading decision. If you are going to trade long bonds, the carry becomes irrelevant- price movements will dominate your total return. That is exactly what happened in 1994 and why the 1-3 year subcomponent of the bond market still managed to generate a positive return of 0.62% that year while the overall index, which also included longer maturity bonds, ended up with a negative return of 2.9%.
At the start of 1994, the yield of the index was 4.36%, much higher than the 2.03% yield at the beginning of 2018. Even though rates increased 350 bp back then, the carry offset the drop in price. The issue with the bond market today, however, is that there is very little carry to cushion the drop in bond prices as interest rates rise. The 75 bp move higher in rates so far in 2018 has had a larger negative impact than the 350 bp spike in 1994. That’s what happens when you have very little yield in relation to duration.
The good news for bond investors is that the year is not even half over. There is still plenty of time for the carry to “catch up” to the performance. With a current index yield of 2.77%, if rates do not move any higher than current levels the total return will swing into positive territory. Rates would have to move roughly 70 bp higher from these levels to end the year with a negative return.
Let’s put things in perspective: as somebody once said, a “bad year for bonds is a bad day for stocks.” Even if the total return ends up in negative territory, we are not talking about a disaster. Sure, investors in short-dated bonds do not expect to lose money, but the magnitude of losses are tiny in comparison to other asset classes. Furthermore, the higher yields that are available after the move improve the prospects for a positive return the following year. The carry, your cushion for a further rise in rates, is much higher.
You are not going to get rich buying short-dated bonds, but you are not going to get “taken to the cleaners” either. Long bonds are a different story. If inflation fears start to creep into the long end of the bond market the resulting price drop will be massive. The 3% yield of the 30-year bond is tiny in relation to the 15% drop in price that would occur if interest rates rise by 100bp. So when you hear the pundits talk about the impending carnage in the bond market, they are referring to long duration securities, not shorter ones. If you are rolling T Bills, for example, the shift higher in interest rates is good news, not a disaster.
Bond investors looking for income may welcome a 2.5% 2-year note, but those with a higher risk appetite who sought to achieve the same thing through an allocation to emerging markets debt are feeling the pain these days. Yields in both local currency and USD emerging market bonds have spiked in the last month.

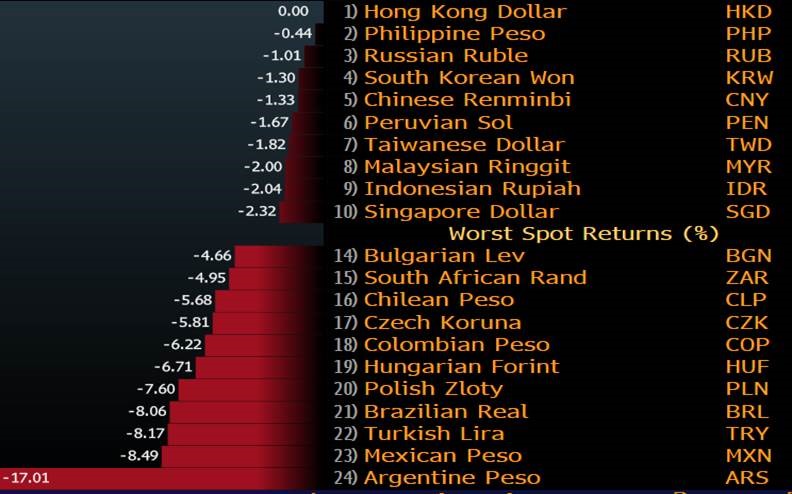
The break higher in the long end of the US yield curve and the sudden strengthening of the USD has once again raised concerns about EM external debt.
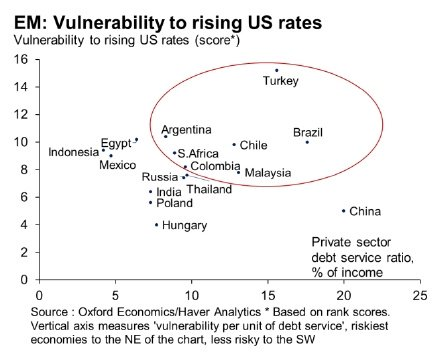
Oxford Economics recently published some research on the topic, highlighting the vulnerability of certain countries. Turkey and Brazil topped the list of countries with the highest risk of a further increase in rates (and therefore reductions in the value of these bonds) and continued US dollar strength.
Developed markets didn’t fare much better. Rates in the US rose, and for the first time in a while, the yield curve actually steepened. 2-year swap rates increased 4 bp, 5-year rates rose 9 bp and 10-year and 30-year rates both climbed 13 bp.


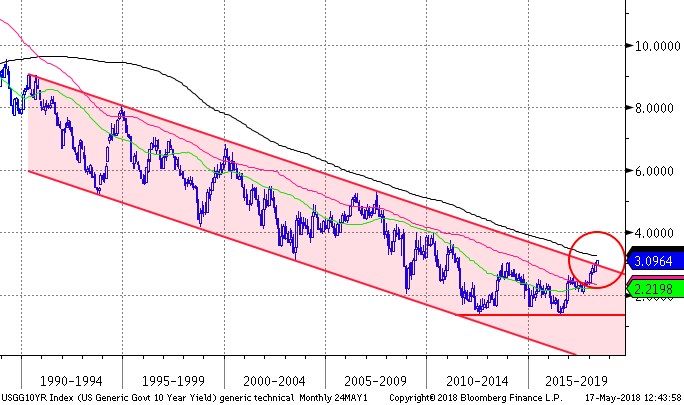
The breach of 3.05% yield level in the 10-year note is significant for a couple of reasons. First, it takes out the cycle high established during the taper tantrum in 2013, and second, it violates a long-term technical channel. Check out the chart below.
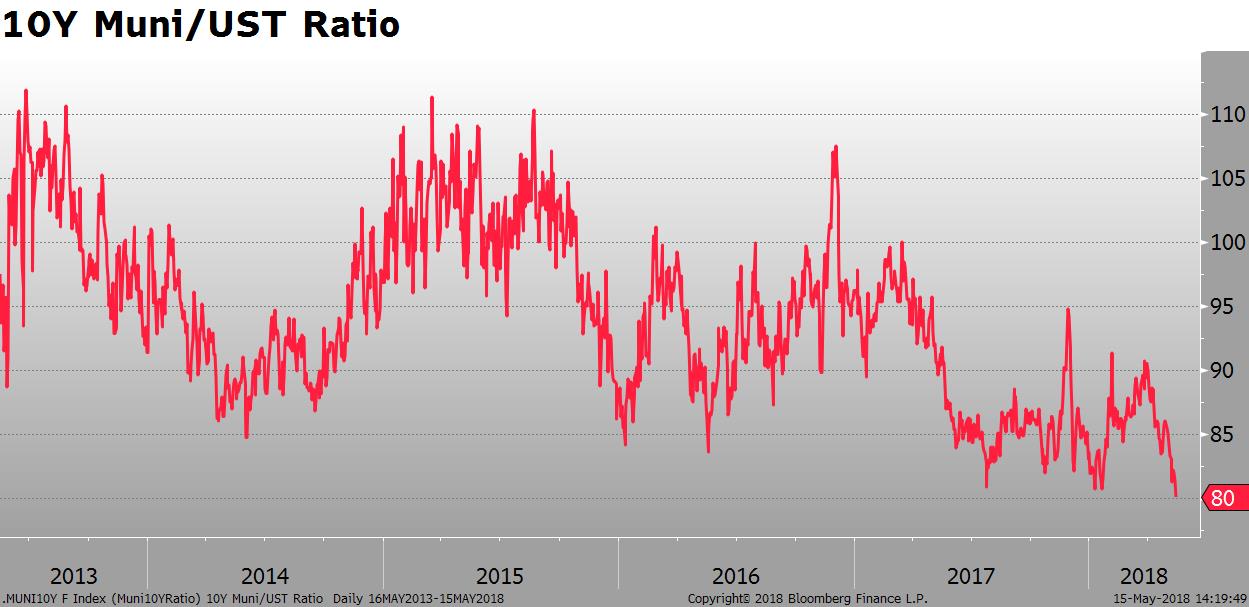
One area within fixed-income that has shown resilience in the rising rate environment is the municipal bond market. The ratio of 10-year muni cash bond yields to 10-year US Treasuries yields dropped to 80%. The risk/reward for long-dated municipal bonds relative to Treasuries is quite poor at the moment given their recent outperformance.
Most other sectors of the bond market had negative weekly returns. The 13 bp sell-off in the long end caused a 2.2% loss for the TLT, an ETF that tracks the performance of US Treasuries longer than 10 years in maturity. The broad corporate bond market, represented by LQD, lost 1.1%.

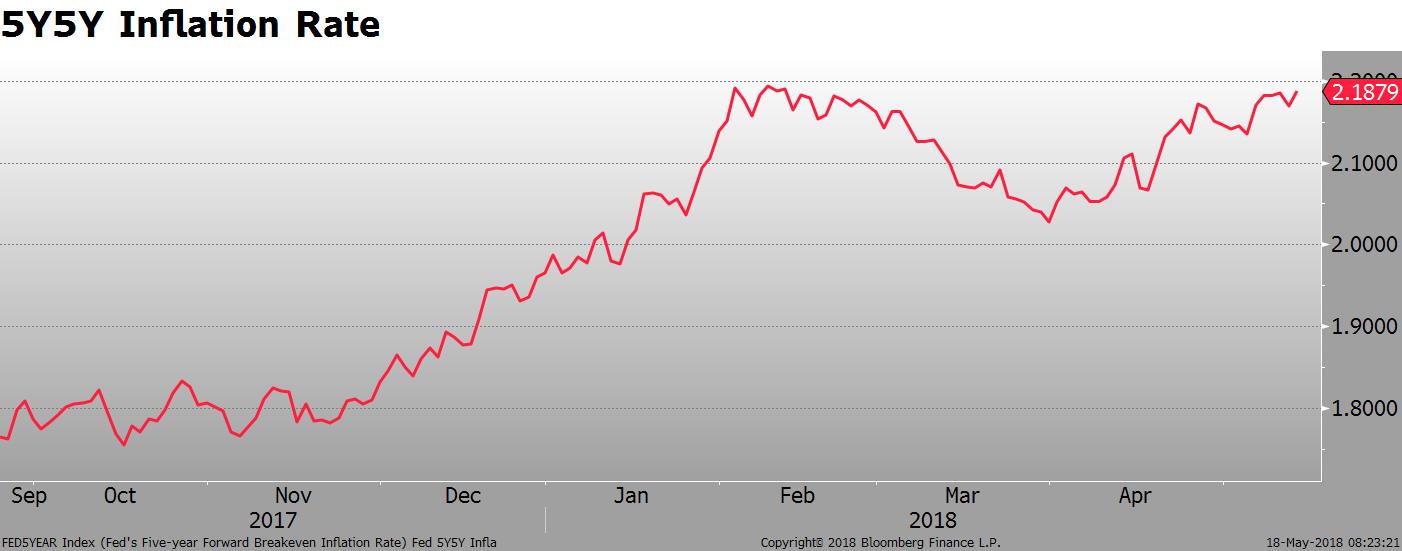
The impact of the rise in crude oil is beginning to spill over into other markets, stoking inflation concerns in the bond market and outperformance by the energy sector in the equity market. The 5 year/5 year forward inflation rate, a market indicator the Fed watches closely, rose 15 bp to 2.19% over the last six weeks.
Another Fed indicator is flashing warning signs. The Cleveland Fed reported that a model it uses to predict long-term inflation expectations, derived from government data, surveys and market expectations, is also moving higher. The average inflation level expected over the next decade moved to 2.09%, up from 1.98% in April. That is the highest model reading since early 2010.
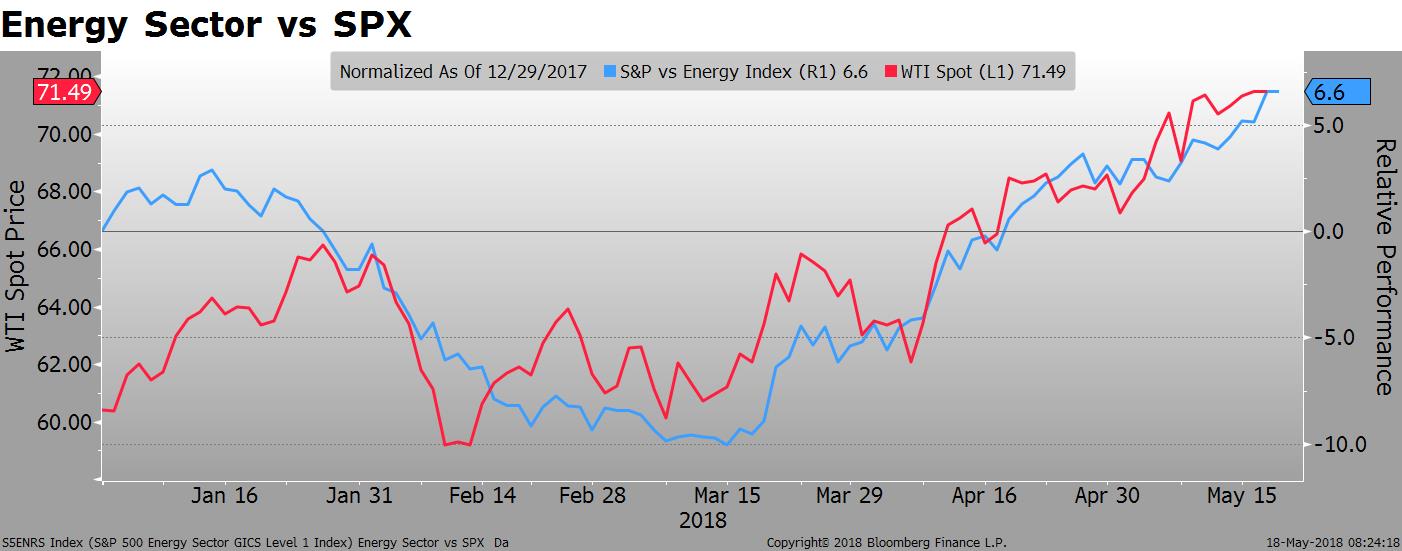
The energy sector is catching up to the spike in crude oil. XLE, the largest and most liquid energy ETF which is dominated by Exxon (22%) and Chevron (17%), has outperformed the S&P500 by 7.6% YTD and by 18% in the last two months. Natural gas prices are also creeping higher, helping the earnings outlook for the large energy producers.
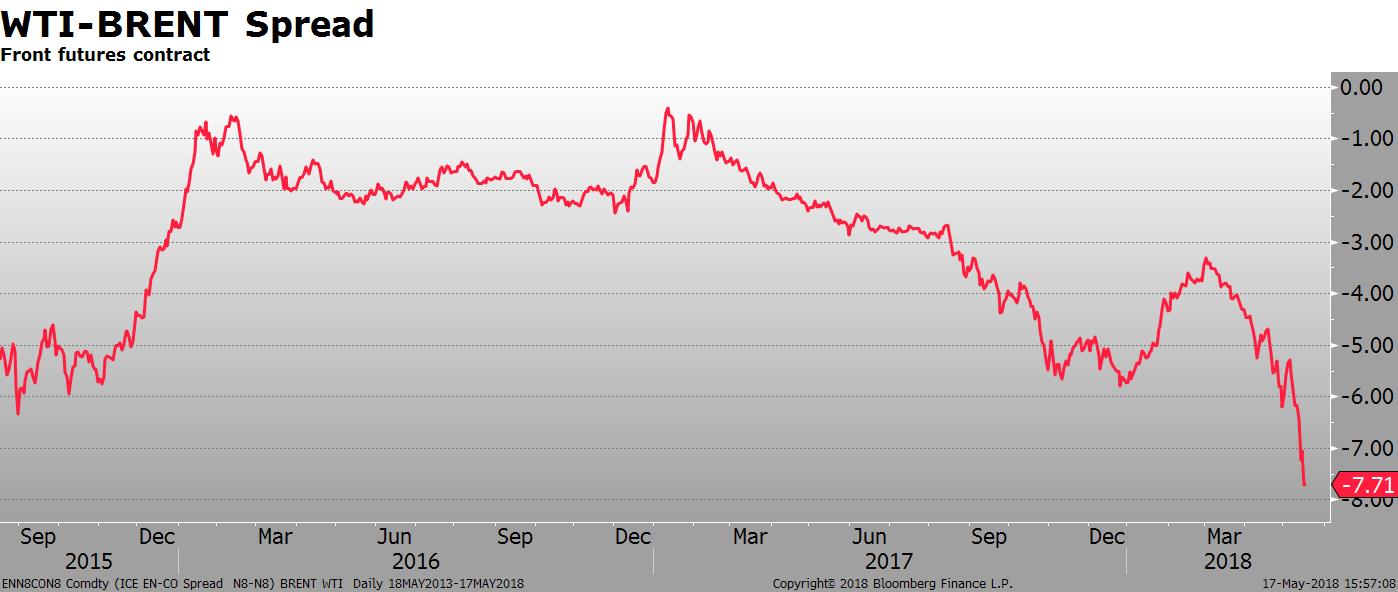
The oil market is experiencing some interesting divergence. The spread between Brent crude, the international benchmark, and West Texas Intermediate, the US benchmark, has widened over the last few weeks. The price of WTI crude has lagged Brent due to relative supply. Total production in the US, led by shale, is suppressing WTI while the adherence to OPEC cuts is creating a shortage of Brent crude relative to demand. The spread between the two grades is approaching $8 per barrel, the widest it has been since 2015.
The other big news this week came out of Italy, where political concerns caused the worst week for the Italian bond market in three years. The League and the Five Star Movement, which formed a coalition government, made some strong anti-Euro statements in a leaked document regarding their political and economic goals. One of the points was a desire to seek EUR 250B billion in debt relief from the ECB to reduce the troublesome debt/GDP ratio by 10%. The coalition has since walked back that demand, but the anti-Euro stance still is cause for concern.
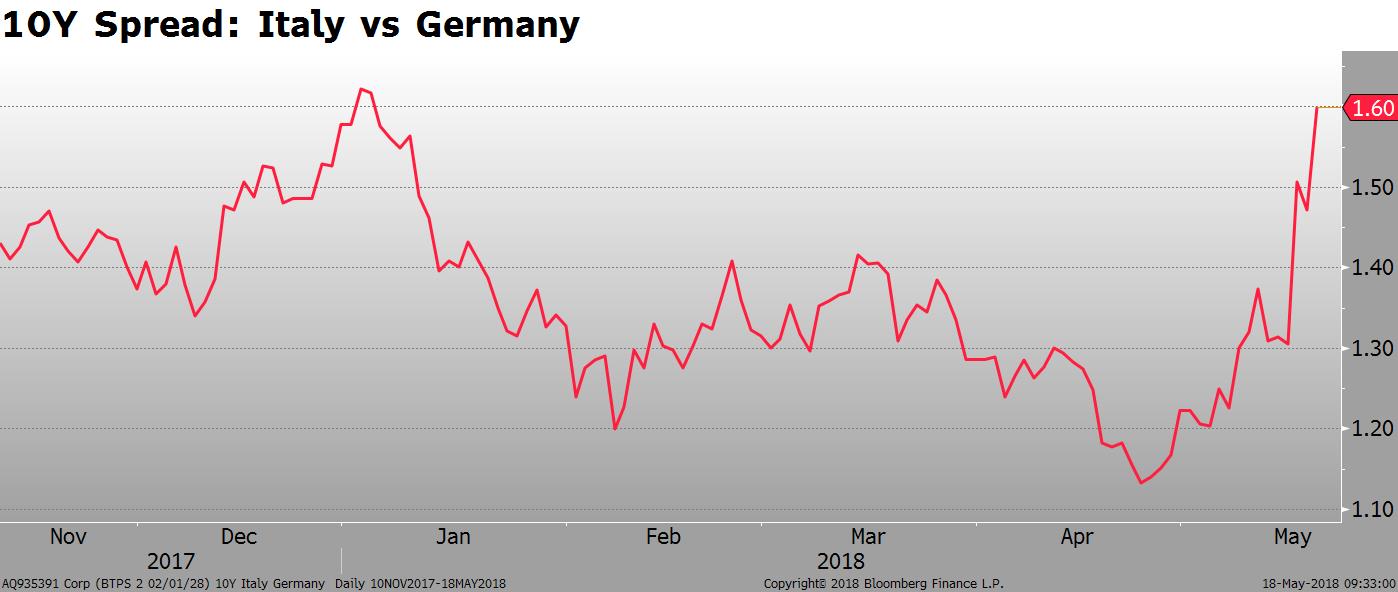
10Y BTPs yields rose 35 bp and the 10Y spread to Germany widened by 30 bp over the course of the week. The weakness spilled over into other peripheral countries. The 10Y spread to Germany this week widened 11bp in Spain, 14 bp in Portugal and 44 bp in Greece.
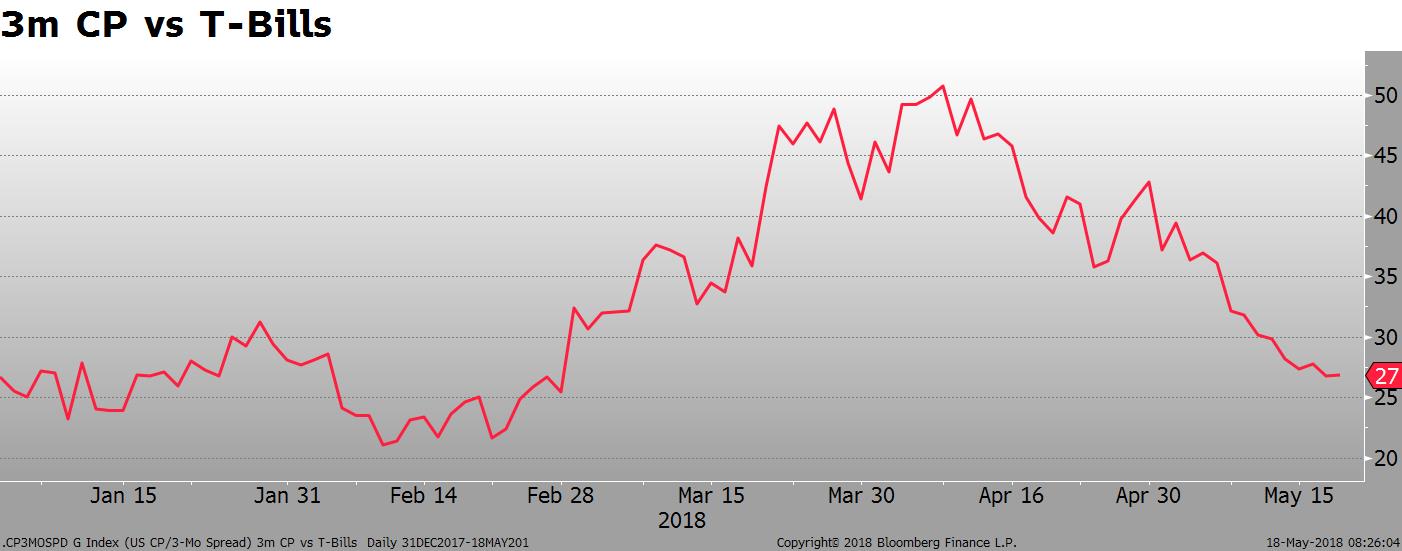
There is some good news for the bond market, however. The supply/demand pressure on the front end of the curve that began earlier this year continues to dissipate. The commercial paper market, for example, has almost fully recovered to late 2017 levels. The spread between 3 month CP and T-Bills has narrowed to 27 bp after being as wide as 50bp in early April.

Next week, the economic focus in the US will be on the Markit PMI and new home sales data set for release on Wednesday. As for markets, I think the situation in emerging markets requires close attention. Additional EM weakness is the most probable catalyst for another wave lower in the equity market.
That’s it for this week. Have a nice weekend.
Here are several articles that go into more depth about some of the topics discussed above.
[listly id=”29Cj” layout=”full” per_page=”25″ show_list_headline=”false” show_list_badges=”false” show_list_stats=”false” show_list_title=”false” show_author=”false” show_list_description=”false” show_list_tools=”false” show_item_tabs=”false” show_item_filter=”false” show_item_sort=”false” show_item_layout=”false” show_item_search=”false” show_item_timestamp=”false” show_item_voting=”false” show_item_relist=”false” show_item_comments=”false” show_sharing=”false”]