Week Ending April 13th
There was a lot of news this week, but most of the action in fixed-income happened outside the US market. The Fed released the minutes from the March 20-March 21 meeting on Wednesday, along with revised economic projections. The release did not have any major surprises and confirmed expectations for the upward path of short-term rates. The only meaningful data points were modest changes to the long run forecast. The Fed adjusted its median projection for the terminal Fed funds rate 0.1% higher to 2.9% from 2.8%.
Participants generally saw the news on spending and the labor market over the past few quarters as being consistent with continued above-trend growth and a further strengthening in labor markets– Federal Reserve Minutes
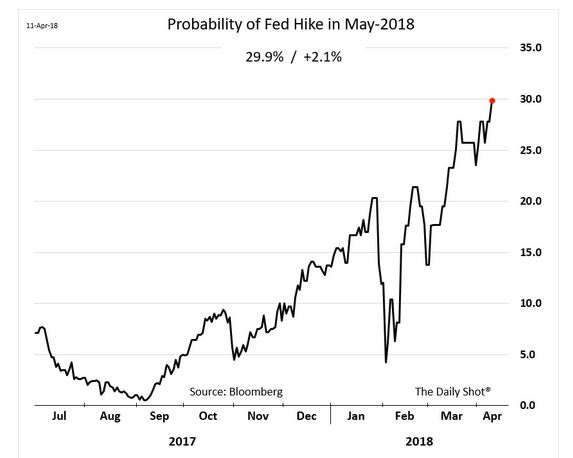
The committee also revised up the projections for the Fed funds rate for 2019 and 2020 by roughly 0.25%, highlighting the potential for a “steeper” trajectory for the path of interest rates. Eurodollar futures sold off and the probability of a rate hike in May climbed to 30% after the minutes.
The Fed news, along with an employment report that validated the medium-term outlook for continued economic strength, helped the yield curve to resume its flattening trend. 2-year swap rates rose 4 bp on the week compared to the 10-year rate which rose just 1 bp.

Using the ETF market as a guide to track sector performance, the high yield market produced the highest total return of 0.9%. The long-end of the US Treasury curve also produced positive returns. An astute reader will see from the above chart that the 30-year swap rate was higher, not lower. So how can long-dated Treasuries increase in price? Swap spreads widened, meaning Treasuries outperformed swaps. In other words, the yield on 30-year bonds fell, but the 30-year swap rate rose.

Another notable event this week was the increase in tensions in the Middle East and the prospects for US military intervention in Syria. Bond yields and currencies in neighboring countries like Lebanon and Turkey surged. The 10-year rate in Lebanon rose 28 bp and the Turkish Lira hit a new low versus the USD. The stress in these emerging markets caused the underperformance of the EM fixed-income ETFs this week relative to other sectors.

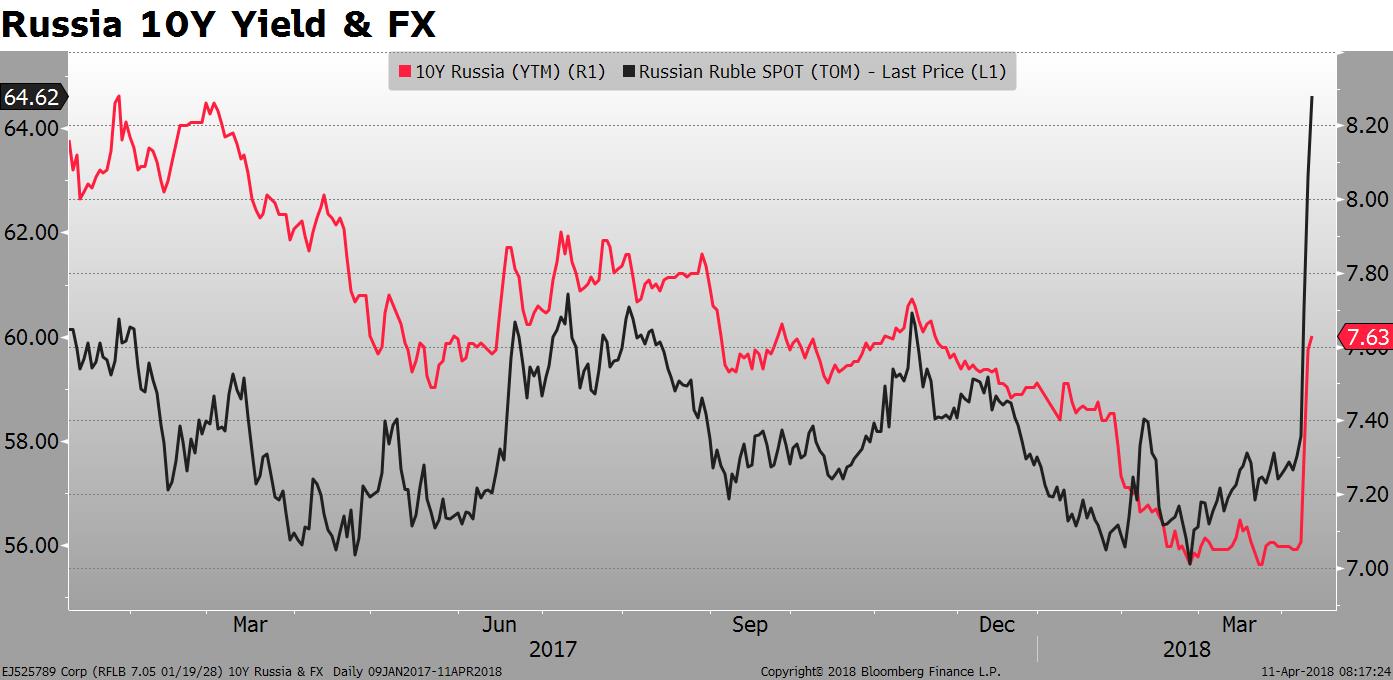
Russian 10-year rates spike 38 bp on the week and the Ruble fell more than 5%. Russia is involved in the Syrian issue, but most of the weakness is from the tough new US sanctions recently imposed on 7 oligarchs, 17 top officials and 12 companies.
The geopolitical uncertainty helped propel crude oil over $67/barrel and to a new 3-year high. Crude also got a boost from an International Energy Agency (“IEA”) report highlighting the reduction in supply from OPEC.

Less than 10 percent of the surplus in oil inventories remains, as OPEC and its partners have cut production. At the same time, global demand remained steady, according to the report.
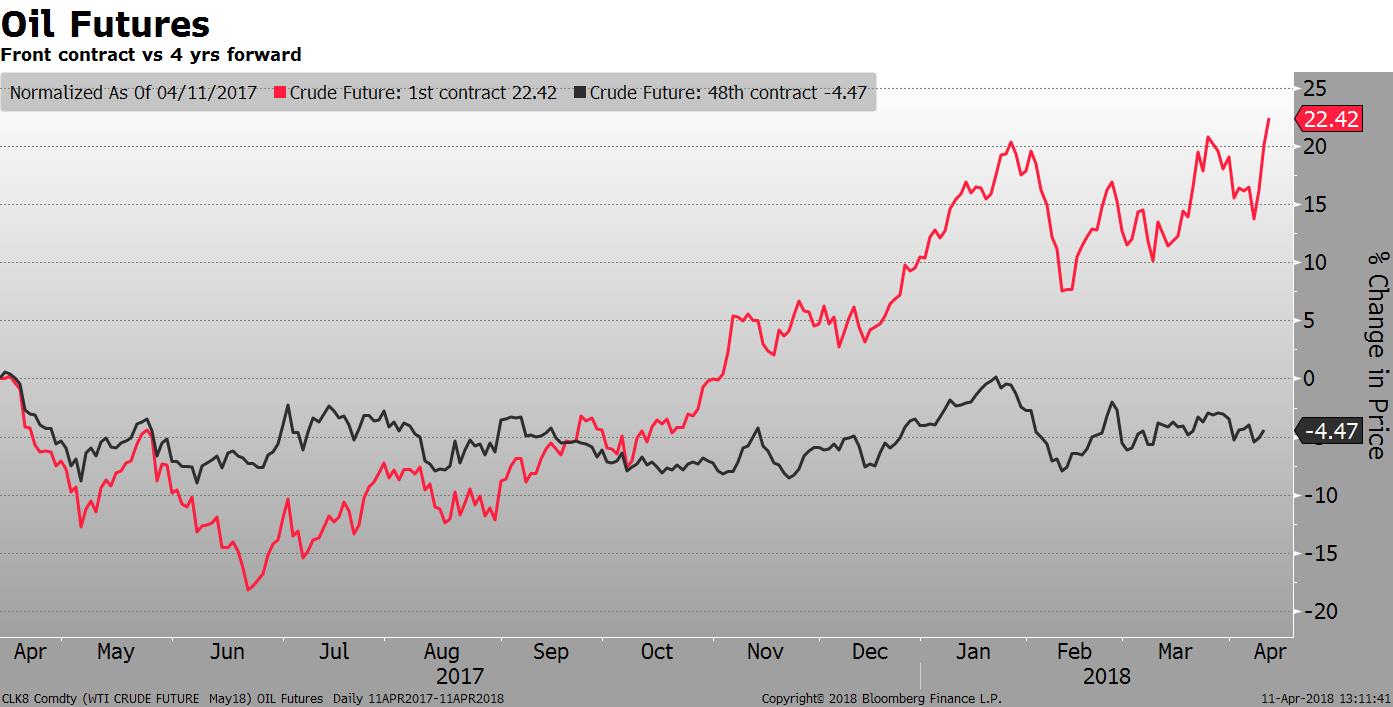
It’s interesting to note, however, that most of the price rise in oil is constrained to the near futures contracts. Over the last year, the 1st futures contract is up more than 22%, yet the price of oil for delivery 4 years from now is 4.5% lower. It’s almost like there are two oil markets. One is in a bull market, the other is in a bear market. Everybody follows the spot price, but the long-term economic prospects for the industry is driven by forward levels. Oil wells are long duration assets and there is a limit to how fast it can be pumped out of the ground.
The hedging activity from producers who are locking in current levels is one of the reasons the futures curve is so inverted. After the 2014 price collapse and the pain it caused to cash flow, most producers want to eliminate as much risk as possible. I would expect the inversion to get even larger if the overall price continues to rise.
Turning to trade, the possibility for reconciliation between China and the US in the ongoing trade dispute eased some pressure on risk assets. Spreads in the high yield market fell 13 bp to 337 bp. Financial and Communications companies led the rally, yet the Industrial and Technology sectors were close to unchanged.

What Is Volatility Anyway?
Last week I wrote an article in Forbes called The Death of Bond Market Volatility. After I published the piece, I realized it may be misleading to some people. How can I say there is no volatility in the bond market when the 2-year Treasury yield is 115 bp higher in the last year? Clearly, the market has moved.
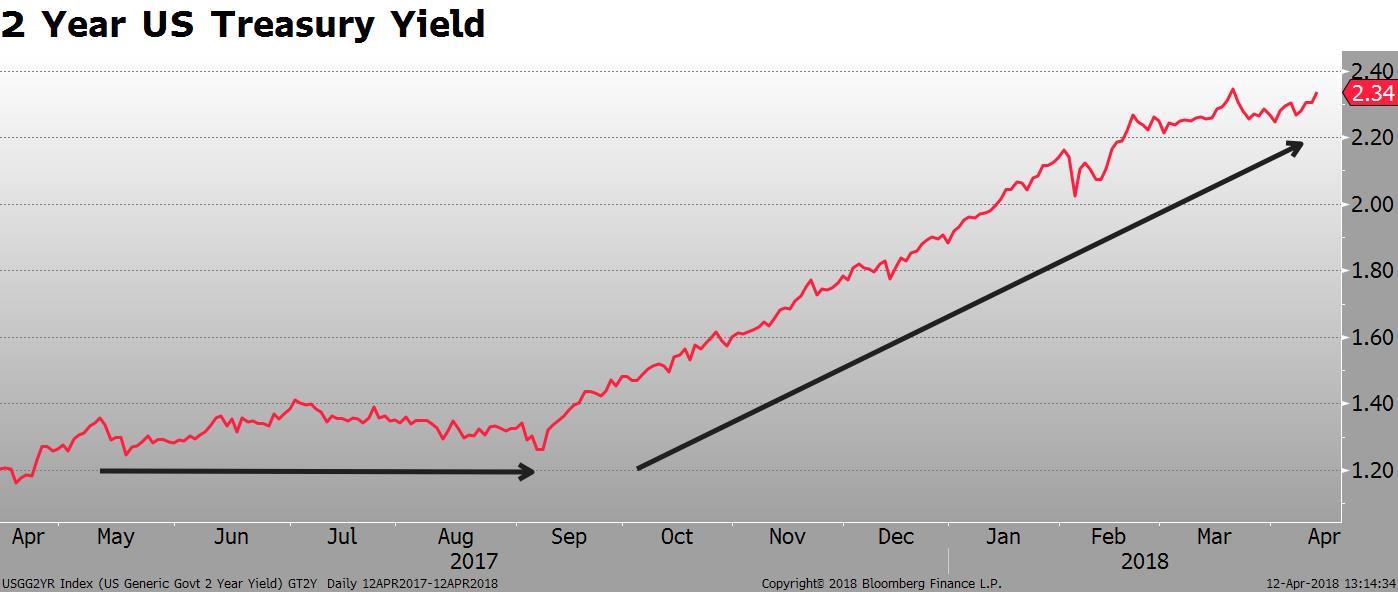
The explanation is that there is a difference between daily moves and a trend. There has been a very strong trend, but that trend has produced very small daily moves. Most options traders are trading volatility, not direction. That means they need to capture daily swings in order to cover the cost of time decay in the option- they don’t run the position unhedged until expiration.
Here is a bizarre statement for you: it is possible for both the buyer AND the seller of an option to make money on the same trade. How? One hedges the direction; the other does not.
For example, if you speculated on higher rates and bought a 12-month put option on the 2-year rate one year ago, and ran the position to maturity, you would have made money. The rise in rates exceeded what was priced by the forwards at the time of the trade and more than covered the cost of the option premium. The trend was that strong.
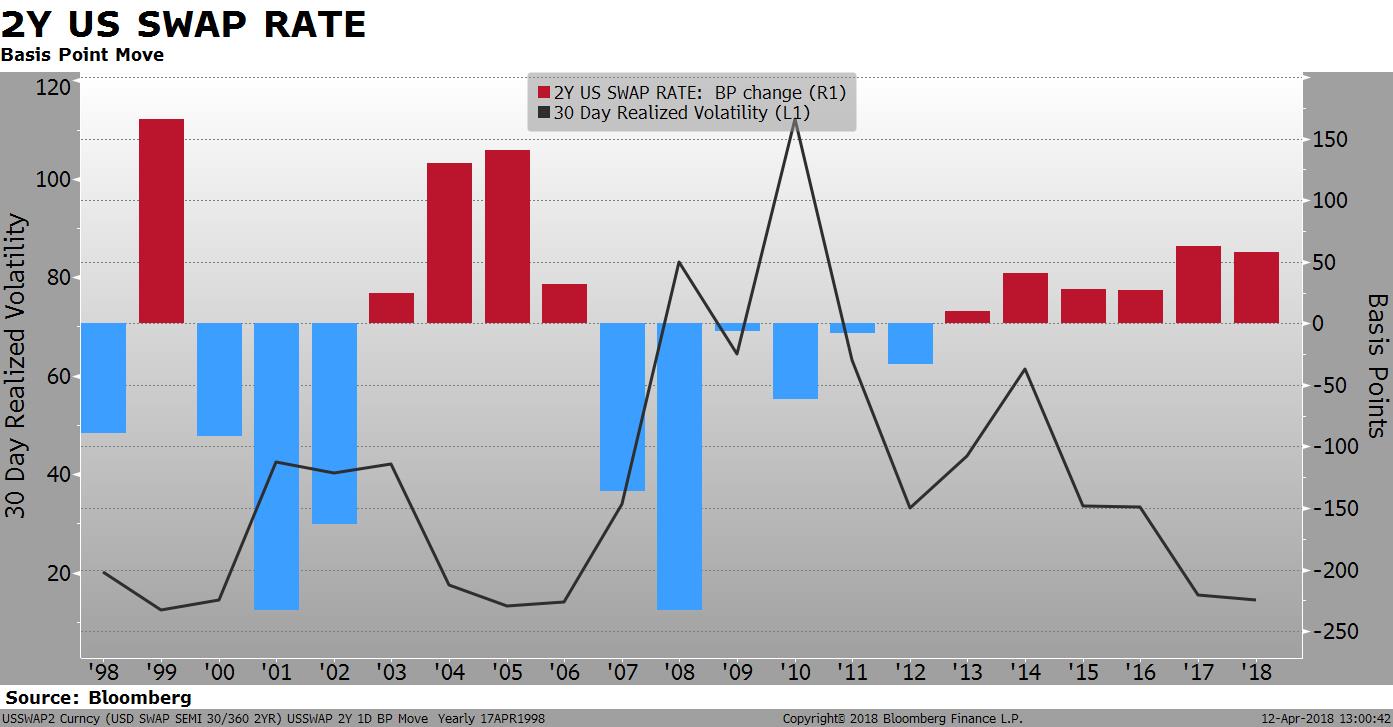
The option seller, though, also profited. The implied volatility at the time of the trade turned out to be greater than the realized volatility over the period. The option seller, who was short gamma, hedged every day. If, for example, the option was priced to expect 3 bp moves every day and the market delivered only 2 bp, the option seller would have made money. That is exactly what happened. The above chart shows the low level of realized 30-day volatility in 2017.
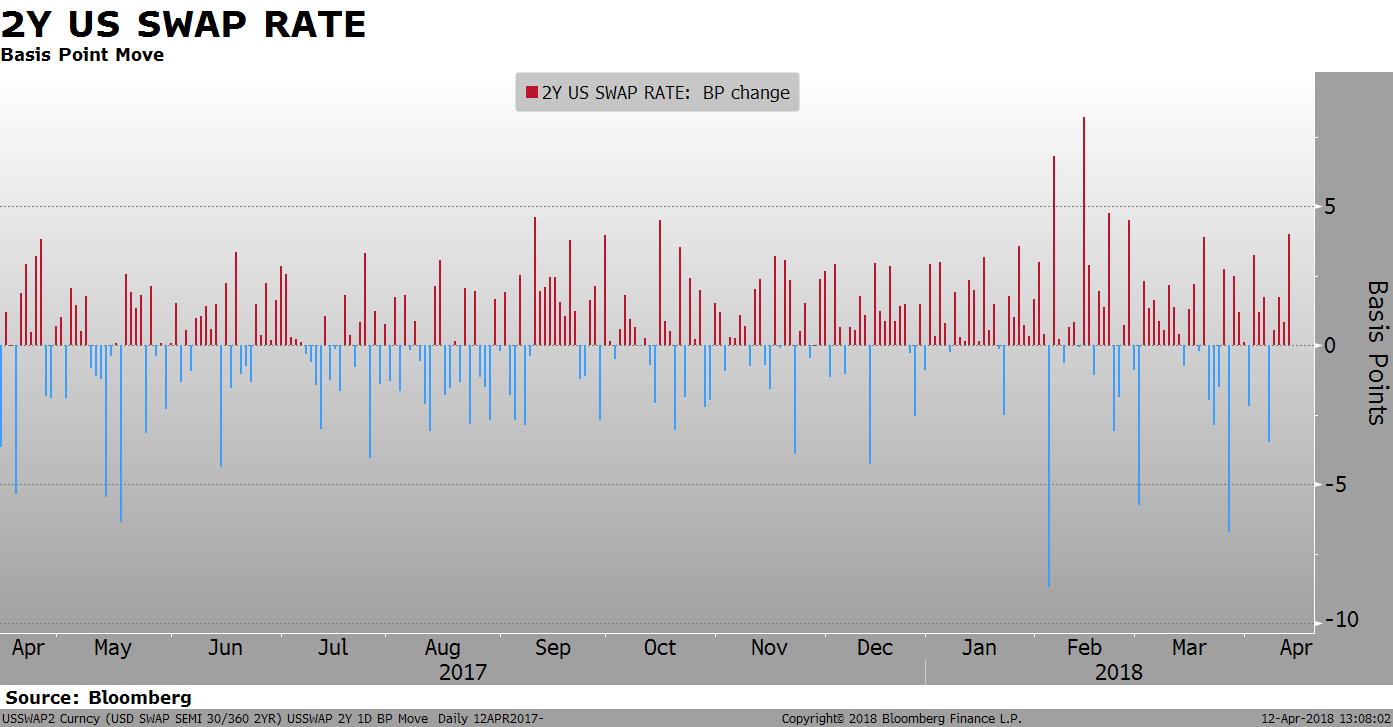
The largest single-day move in the 2-year swap rate in 2017 was 8.7 bp. Yes, the option seller probably lost money that day. However, there were only 4 other days all year when the market moved more than 5 bp. There were many days when the 2-year rate fluctuated just one or two basis points.
The conclusion is that in a slow, grinding market, there can still be significant end-to-end movements, without the need for large, daily gyrations; a bond that moves up in yield just 0.5 bp every trading day will be 130 bp higher by the end of the year. It may be hard to make money from trading volatility, but if you get the direction right, there are still profit opportunities if you use options to trade the trend.
News
Here are links to some of the top stories of the week:
[listly id=”24FE” layout=”full” per_page=”25″ show_list_headline=”false” show_list_badges=”false” show_list_stats=”false” show_list_title=”false” show_author=”false” show_list_description=”false” show_list_tools=”false” show_item_tabs=”false” show_item_filter=”false” show_item_sort=”false” show_item_layout=”false” show_item_search=”false” show_item_comments=”false” show_item_relist=”false” show_item_voting=”false” show_item_timestamp=”false” show_item_numbers=”false”]