
There are moments in playoff hockey when a single play, such as a massive check or a spectacular save, can change the game’s momentum and affect its outcome.
That happened in game 2 of the Panthers/Lightening series when Florida’s Sergei Bobrobvski robbed Tampa’s Matt Dumba of what was to be the go-ahead goal. Bobrovsky spun his body in front of the goal to make a miraculous save with his arm to deny Dumba’s backhanded shot on what looked to be an open net. Nobody expected him to make the stop and it clearly was a pivotal moment in the game.
A similar surprising save happened in the markets last week. After weaker-than-expected GDP numbers and higher-than-expected inflation caught the markets off guard, risk assets cratered and interest rates spiked. Just when things looked hopeless, earnings blowouts from the tech sector completely changed the narrative.
The reality is that the economic data is probably not as bad as the headlines suggest. Nor does it imply that the earnings strength of Google and Microsoft means other sectors will be able to maintain margins in a higher-for-longer interest rate environment.
GDP and Earnings
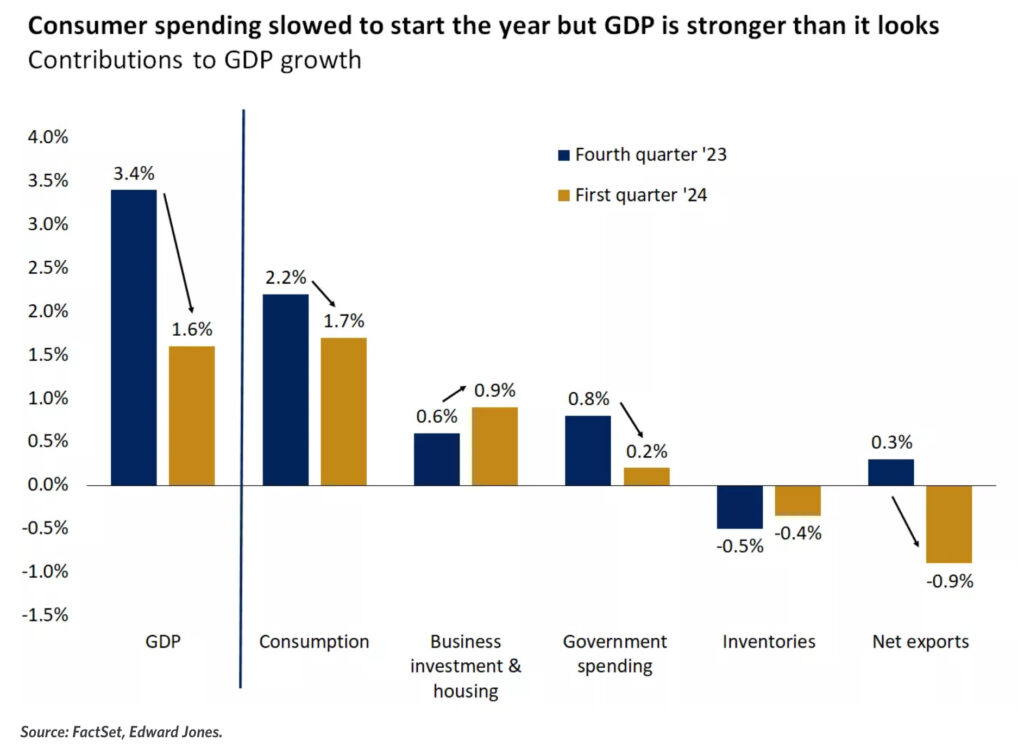
The initial estimate from the BEA puts Q1 real GDP growth at an annual rate of 1.6%, which falls significantly below expectations. This marks the end of a streak of six consecutive quarters with growth above 2%. Consumer spending, business investment and residential fixed investment were the primary supports for growth. A wider trade deficit (strong US dollar finally impacting exports?) and a slower pace of inventory accumulation acted as meaningful drags on Q1 growth. A drop in defense spending also dented output. If there was good news in the report, it was real private domestic demand, which rose at an annual rate of 3.1% in Q1, down only slightly from 3.3% in Q4 2023.
Turning to earnings, roughly half of the S&P500 has now reported. The EPS beat rate is around 78%, while the sales beat ratio is healthy at approximately 58%. These beat rates are in line with 5-year averages. It looks like Mag 7 stocks will meet or even exceed lofty expectations. According to Morgan Stanley, these mega-cap tech stocks are projected to see an incredible 47% year-over-year net income growth in Q1 (versus -12% year-over-year for the SPX ex-Mag7).
Alphabet (Google) led the charge. Its market value closed above the $2 trillion level for the first time on Friday. It was not just revenue and earnings that propelled the stock up more than 10%. The company released a new capital allocation plan, including a quarterly dividend of 20 cents per share and a $70 billion stock repurchase program. It also confirmed plans to continue to invest heavily in AI. Analysts at Baird estimate that capital expenditures by Alphabet, Amazon, Microsoft and Meta this year will total about $188 billion, almost 40% more than in 2023. $188 billion! In a single year! Now THAT is investing for the future, assuming the bets pan out.
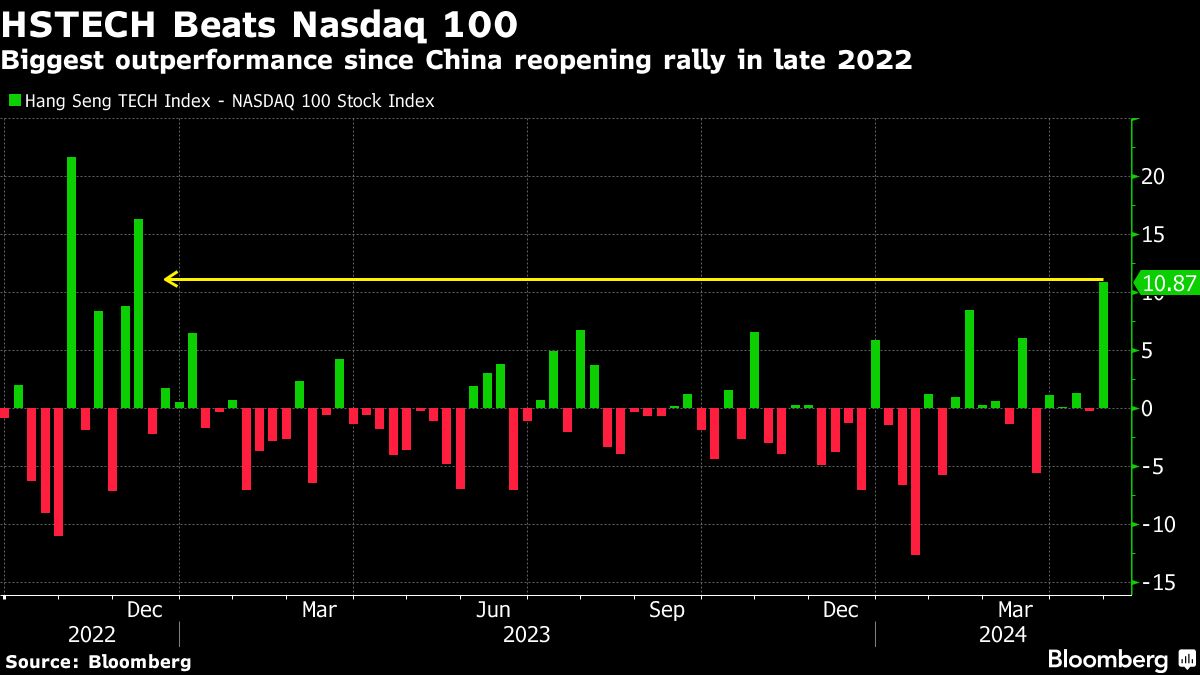
Another surprise was the move in Chinese equities. Stocks in China and Hong Kong are showing signs of resurgence after being written off by most of the investment community, outperforming most of the rest of the world last week. FXI has jumped more than 9% in the last month, with most of the move happening last week. And closing Friday on top of its 200-day moving average. The Hang Seng Index had its best week since 2011.

Chinese tech leaders like Alibaba, Tencent and JD have each announced billions in buybacks over the past few months and are leading the market higher. Cheap valuations, stock market reforms and a return of foreign capital are all contributing to the rebound. As good as it was for the Nasdaq last week, tech stocks in Hong Kong were even stronger.
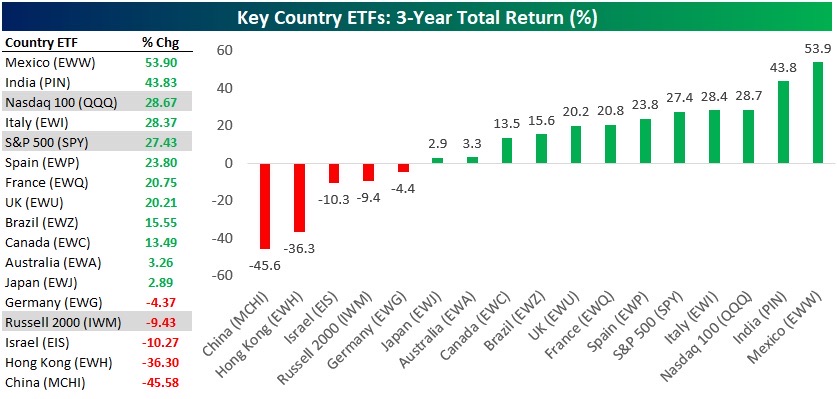
With Chinese equities up almost 20% from their January lows and with so many investors still underweight in their equity allocations, a material breach above the 200-day moving average could force further capitulation into the market. Despite the turnaround in market prices, there are no signs that the geopolitical tensions between China and the US are improving. Until that happens, many allocators may still deem China as “uninvestable.” And anybody running an overweight in China in the last three years has not looked too good, especially when other EM alternatives, like India and Mexico, have provided opportunities for outperformance.
Other things of note from last week:
- Commodity markets are still moving wildly. US natural gas prices dropped another 6%, testing the one-year low. Intraday cash prices at the Waha hub in the Permian Basin fell to around -$3 per million British thermal units from around -50 cents earlier in the day. Yes, negative prices. Kinder Morgan shut a pipeline segment, trapping gas in the region.

- AAII Bull-Bear Index turned negative as a sign of deteriorating retail sentiment. Bears now outnumber bulls for the first time this year.

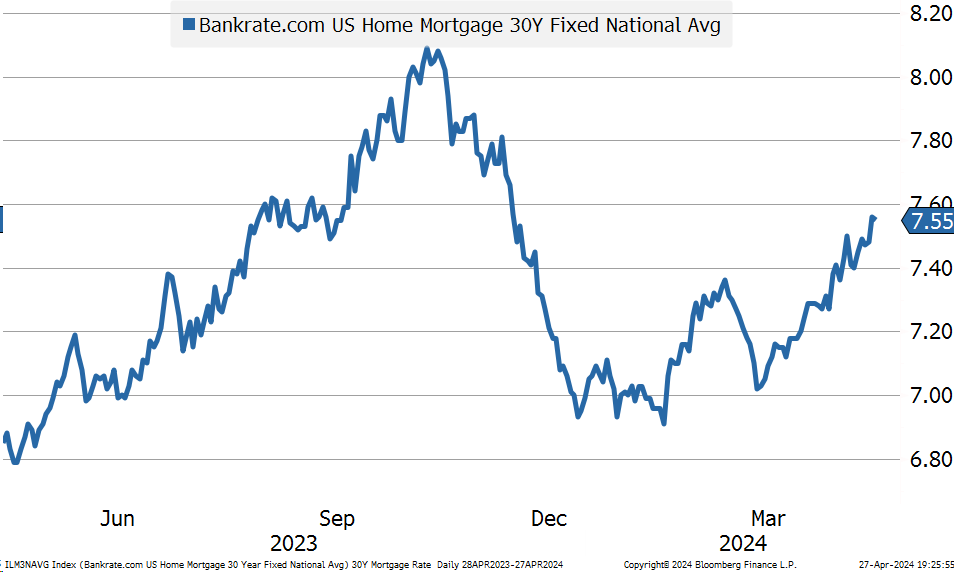
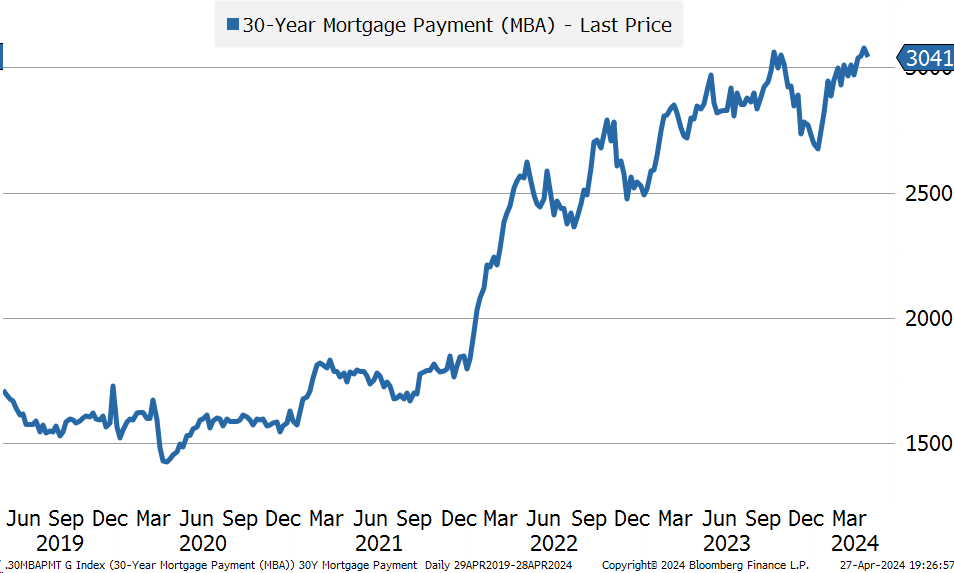
- 30-year mortgage rates jumped to 7.56%, more than 60 bps higher than they were in January. Housing affordability is getting worse, not better. The average mortgage payment is back above $3,000 per month.
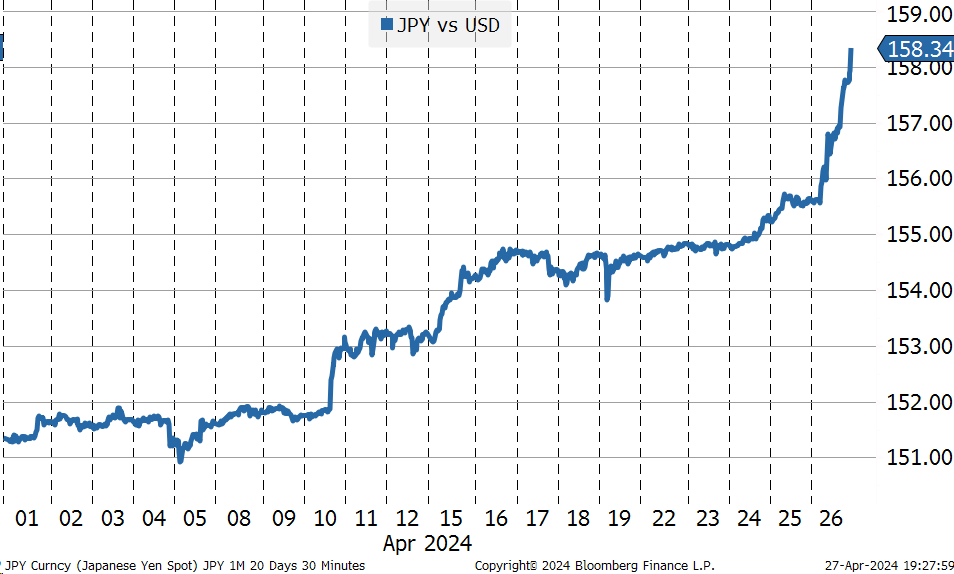
- The Japanese yen fell to a fresh cycle low above 158 versus the dollar after the Bank of Japan stood pat on interest rates and Governor Ueda did little to push back against recent weakness in the press conference.
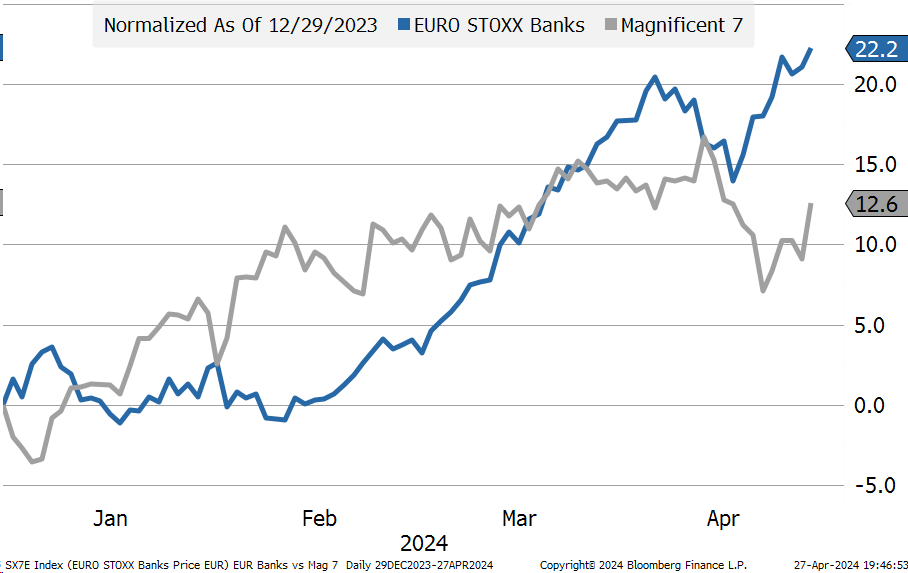
- European banking stocks hit their highest level since 2015 on Friday, helped by first-quarter earnings that beat forecasts. The SX7E index has gained 22.2% this year, outpacing a 6.1% rise in STOXX 600 and even outperforming Mag 7.
Asset Allocation
At least once a week, I get asked, “What would you buy right now?” I rarely have strong views on individual stocks, industries, themes or market timing. I leave that to people who spend countless hours pouring over financial statements in great detail and who have spoken to management and have a clear idea of strategic competitive advantage. I prefer to focus on allocation and try to identify the best risk-adjusted assets to own with a medium or long-term time horizon.
Besides, asset allocation almost always trumps security selection and history has shown that market-timing is a good way to leave a lot of money on the table. The tricky part of giving advice about asset allocation is that the right allocation is dependent on a variety of factors. A multi-billion university endowment fund with an ultra-long investment horizon can afford to take more risk in exchange for volatility, move down the liquidity spectrum into private markets to earn extra risk premium, and invest in securities and strategies regardless of tax consequences. The right allocation for these institutions will look very different from Grandma, who has little understanding of financial wizardry and just wants to get a check every month from her advisor to pay her fixed expenses.
So when people ask me the question of what to buy, I feel it is a little irresponsible to provide recommendations without knowing what is right for that individual. That said, I do have a few “go-to” ETFs and funds that I suggest to people from time to time. One of those is the Blackrock Capital Allocation Term Trust (BCAT).
BCAT is an actively-managed closed-end fund with a relatively conservative asset allocation (close to 60/40 equity/bond), runs low interest rate risk (less than 2-years in duration), contains exposure to private equity and private credit (roughly 13% allocation), incorporates an option-selling overlay (10% of portfolio), generates attractive income (mainly through stock dividends, bank loans and option selling), and has a 9.9% distribution. The best part is you can buy this pool of assets at a 10% discount.

Closed-end funds often trade at a discount to net asset value, meaning that the price of the fund trades at a level below the fair value of the assets in the portfolio. Unlike most funds, however, BCAT has a fixed term, meaning that in September of 2032 (8 years from now), the fund will take steps to return the fund to fair value by either liquidating the portfolio or tendering for shares at net asset value. This feature ensures the discount to NAV will close over the next 8 years and show up in BCAT’s total return.
Investors may not have to wait until the end of the trust term to see the discount to NAV narrow. Saba Capital, an activist hedge fund that specializes in taking a large position in funds and then working with management to narrow the discount, owns a 15.2% stake, according to recent 13D filings.
The fund is run by Rick Rieder, Blackrock’s Global CIO of Fixed Income. I know Rick personally and have had the good fortune to sit with him on an investment advisory committee. He is a highly impressive guy who knows his stuff. In other words, I trust his ability to identify cheap, attractive risk-adjusted assets. Here is a recent clip of Rick talking about his views on fixed-income markets:
Here is a summary of year-end highlights from Blackrock that details some information on performance, distributions, portfolio allocations, and other activities:


Is there anything I don’t like about BCAT? While I love the near 10% dividend, I don’t love the 1.4% expense ratio. The management fee is fair for closed-end funds but high to get exposure to large-cap equities and bank loans. When you factor in the private market exposure (which usually has higher fees to access), the active management, and the discount, the fees seem reasonable.
That’s it for this week. But before you go, check out the short video below of the save I mentioned at the start of the post. Some people say it is the best save they have ever seen. It’s pretty incredible.