
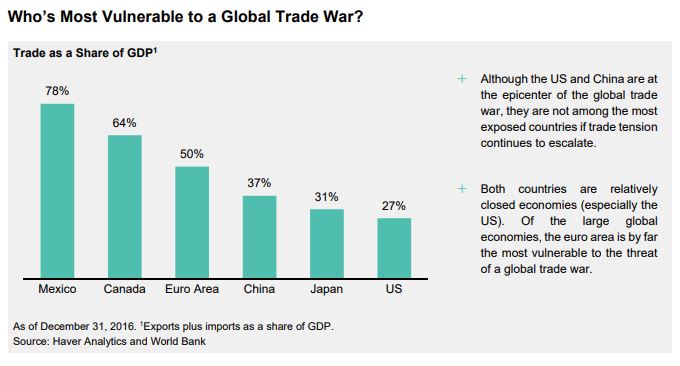
1. Trade War
The next week or so should bring some clarity over NAFTA talks and whether US and Mexico, followed by Canada, can strike a deal. The economies of Mexico and Canada are the most vulnerable to a protracted trade war.
2. Corporate Credit Fundamentals
Corporate credit fundamentals are still strong but are deteriorating. Interest coverage ratios are the lowest since 2010 and will drift lower as interest rates rise. 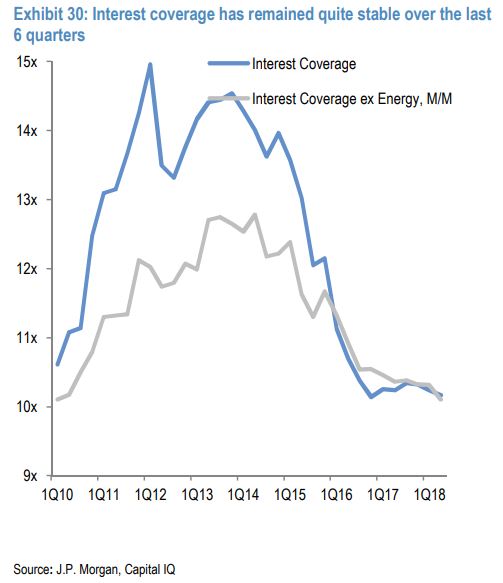
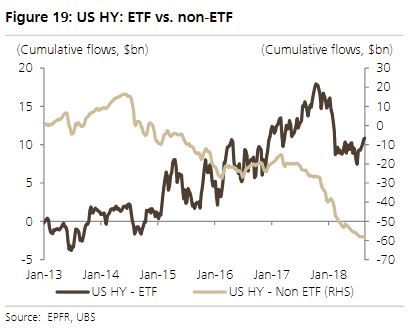
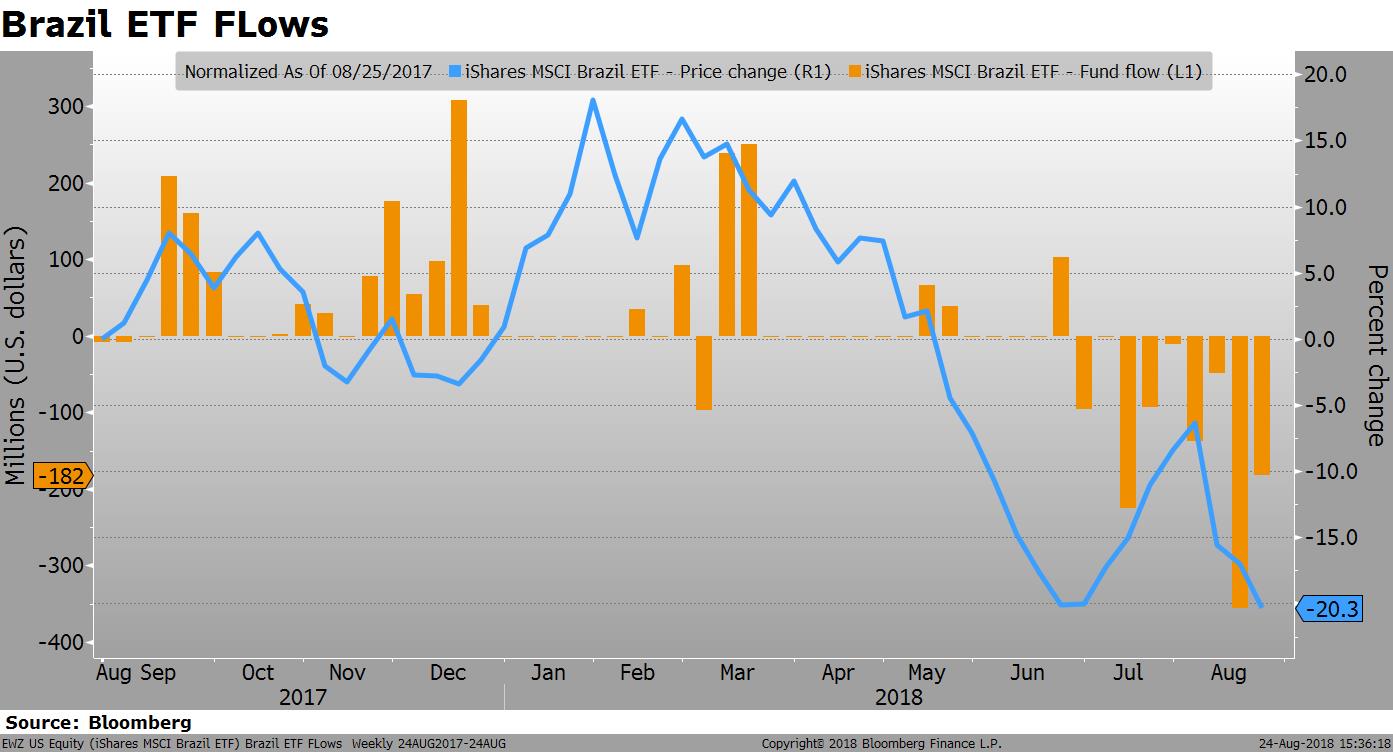
3. Brazil
It was a rough week for Brazilian assets. The currency lost 4.7% of its value versus the USD and the EWZ, the main ETF that tracks the equity market, is off more than 20% YTD. There has not been a positive inflow to the ETF since June.
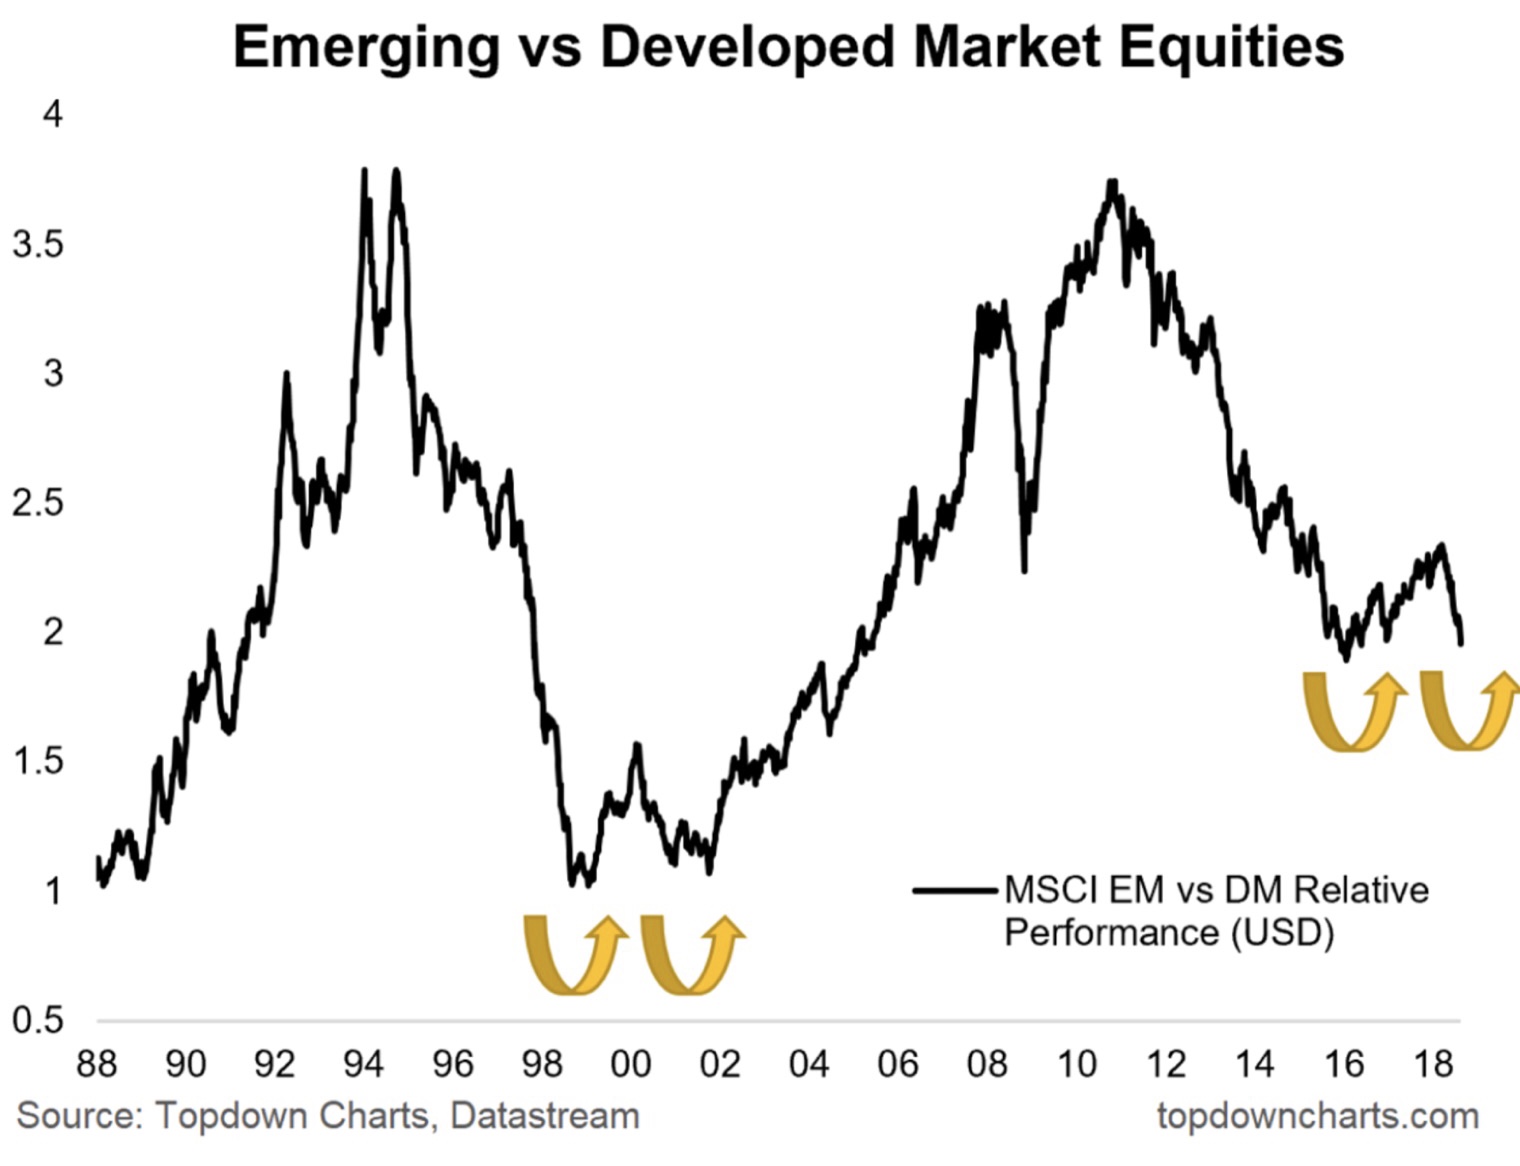
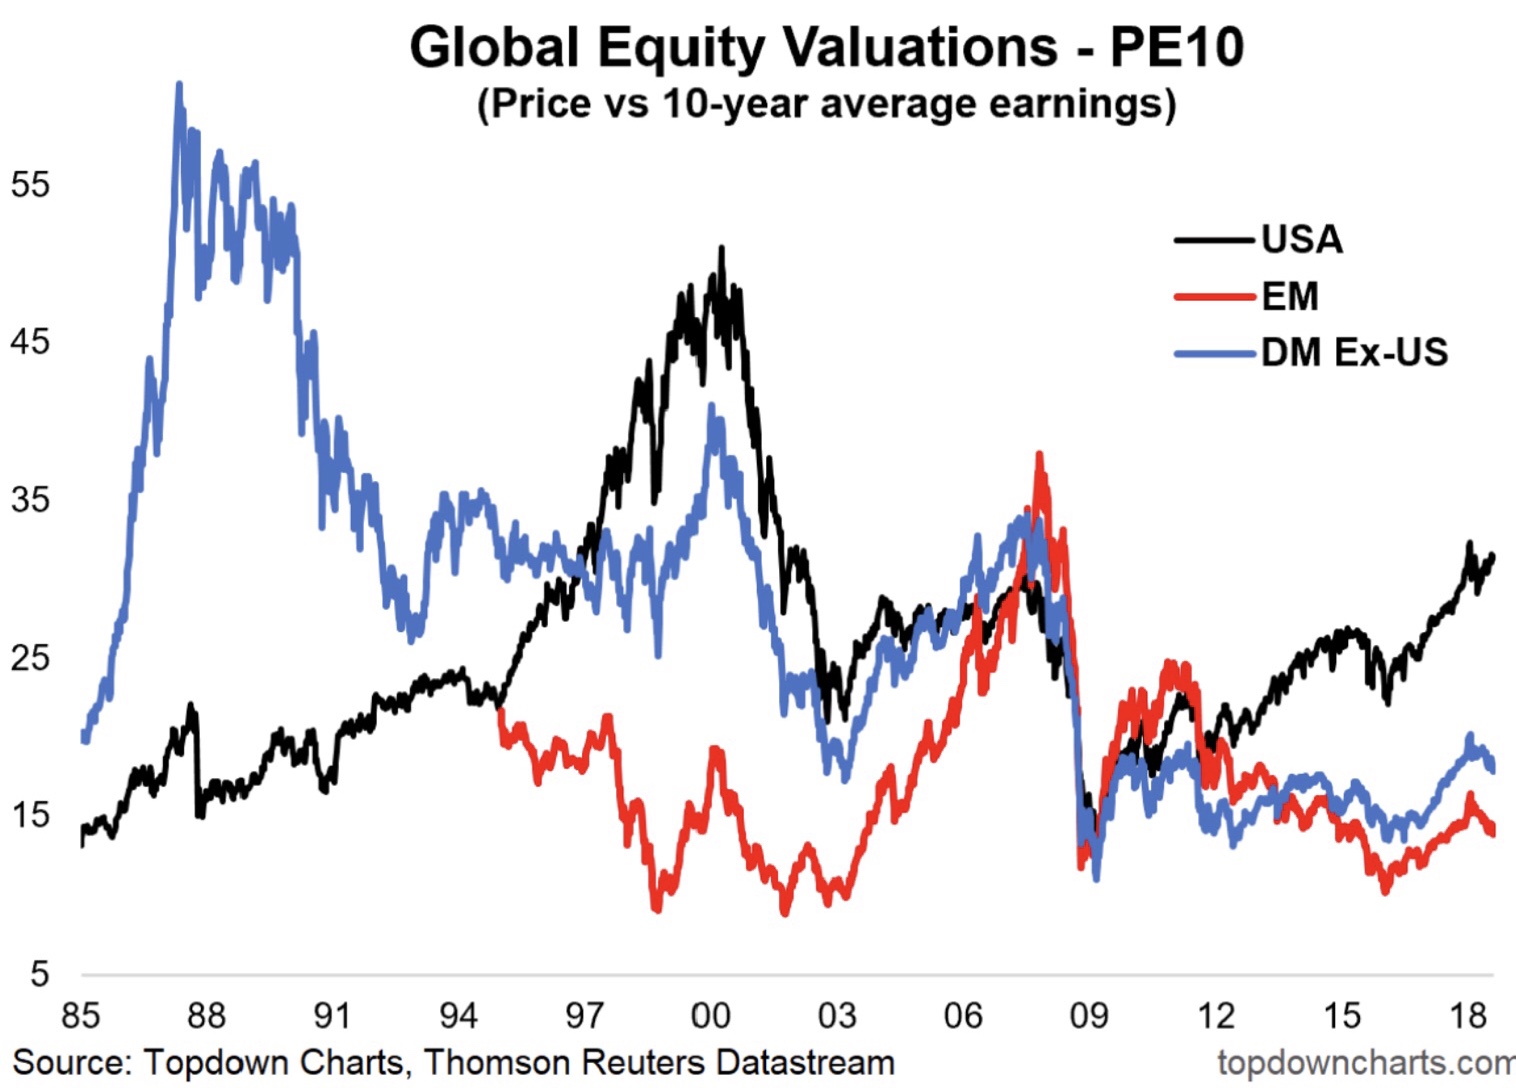
4. EM Valuations
As EM and International equity markets continue to underperform US equities, the gap in relative valuations grows. The ratio between price and 10-year average earnings in the US is the highest since the GFC; the ratio for EM is closer to the lows than the peak.
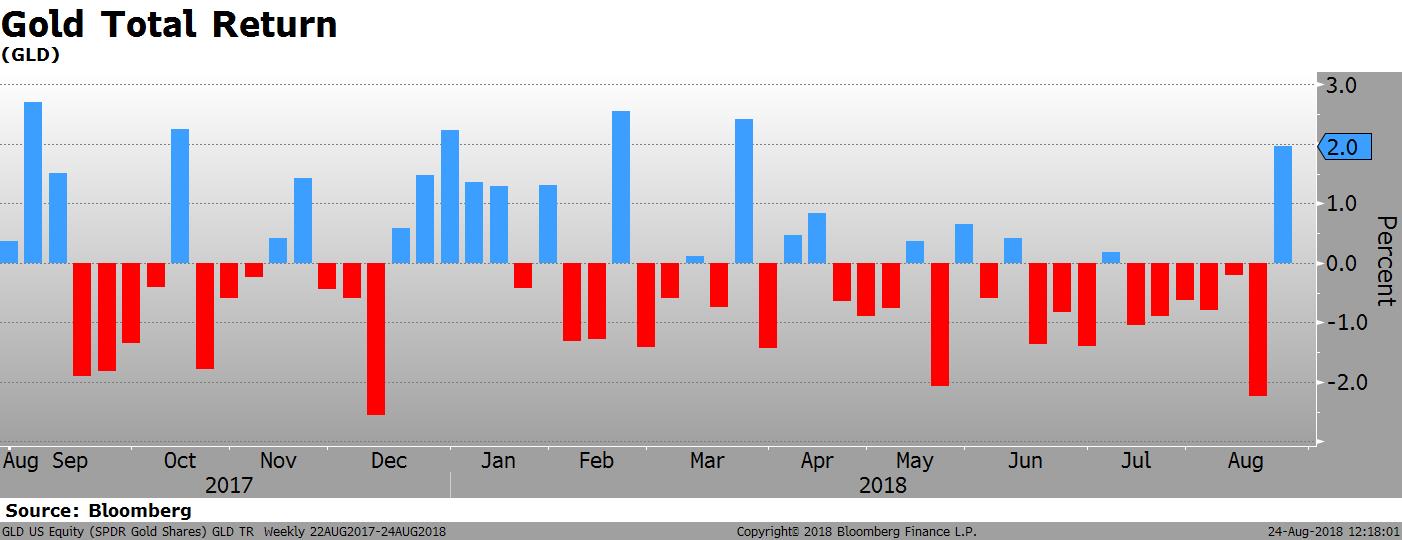
5. Gold Returns
Gold finally generated a positive weekly return, largely due to the recent retracement in the USD. It is headed toward its 5 month in a row of negative returns.
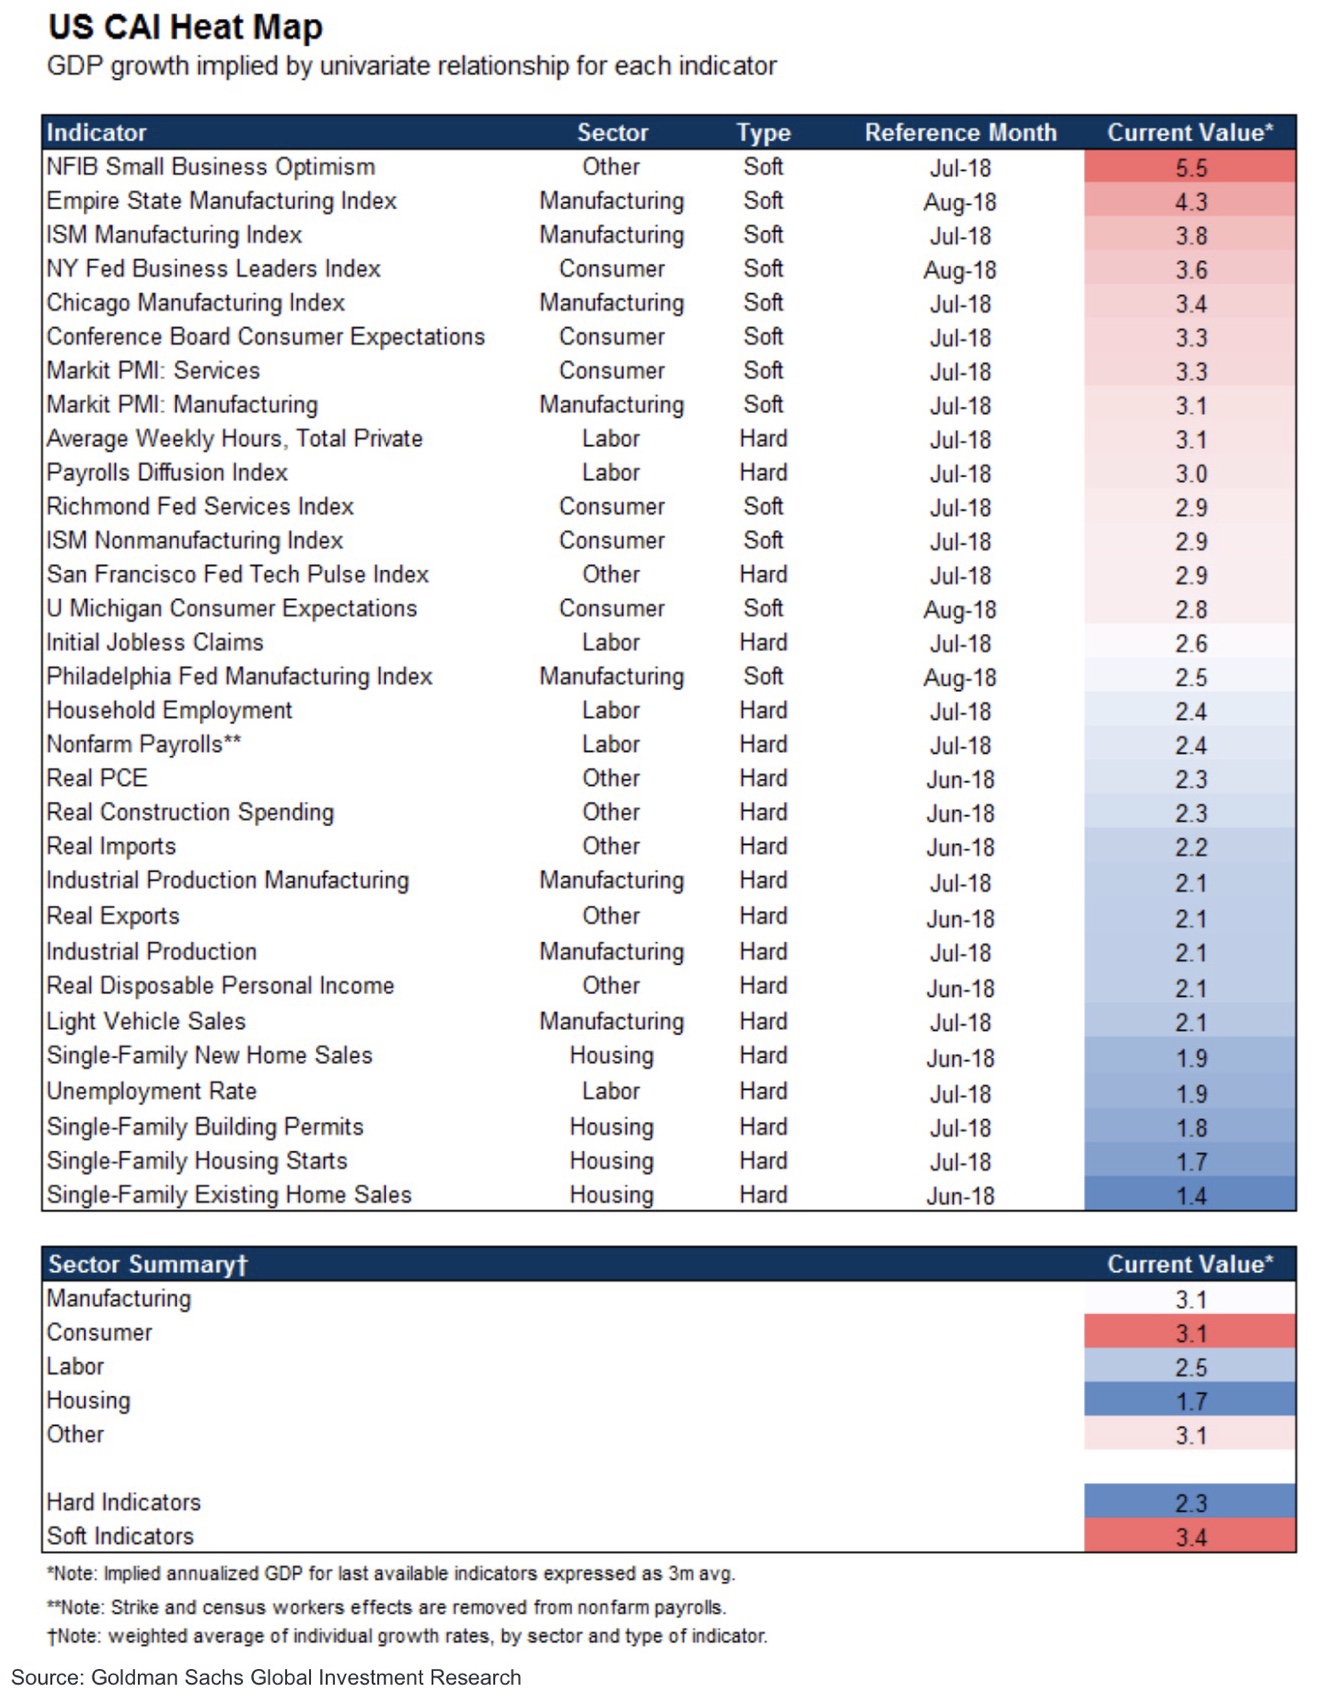
6. US Economic Outlook
The GS CAI (Current Activity Indicators) is a good way to follow which areas of the economy are hot and which areas are not. Interestingly, the “soft” indicators are indicating more strength than the “hard” indicators. That has been the theme for most of the year.
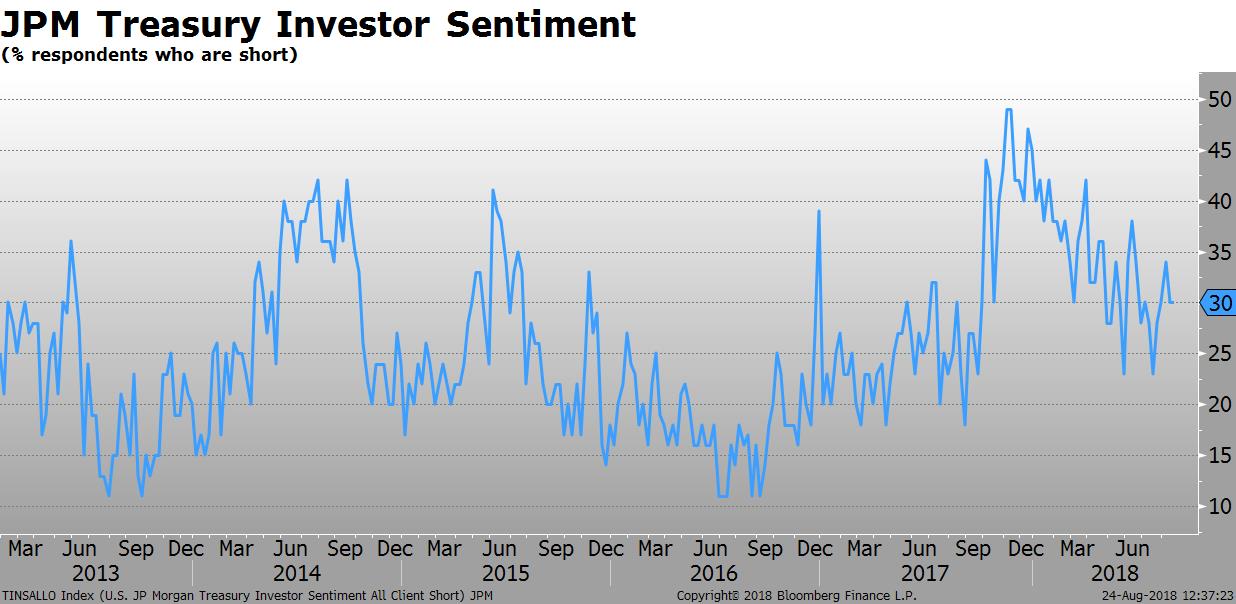
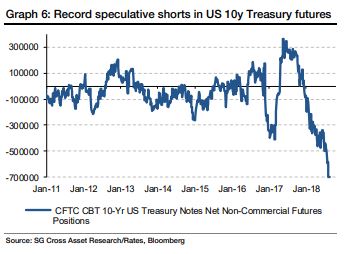
7. US Treasury Investor Sentiment & Positioning
There is large difference between position-based sentiment indicators and survey indicators. The JPM UST survey shows the number of investors claiming to be short at 30% vs almost 50% at the start of the year. CFTC positions suggest a record number of shorts. Who is right? (I don’t know.)
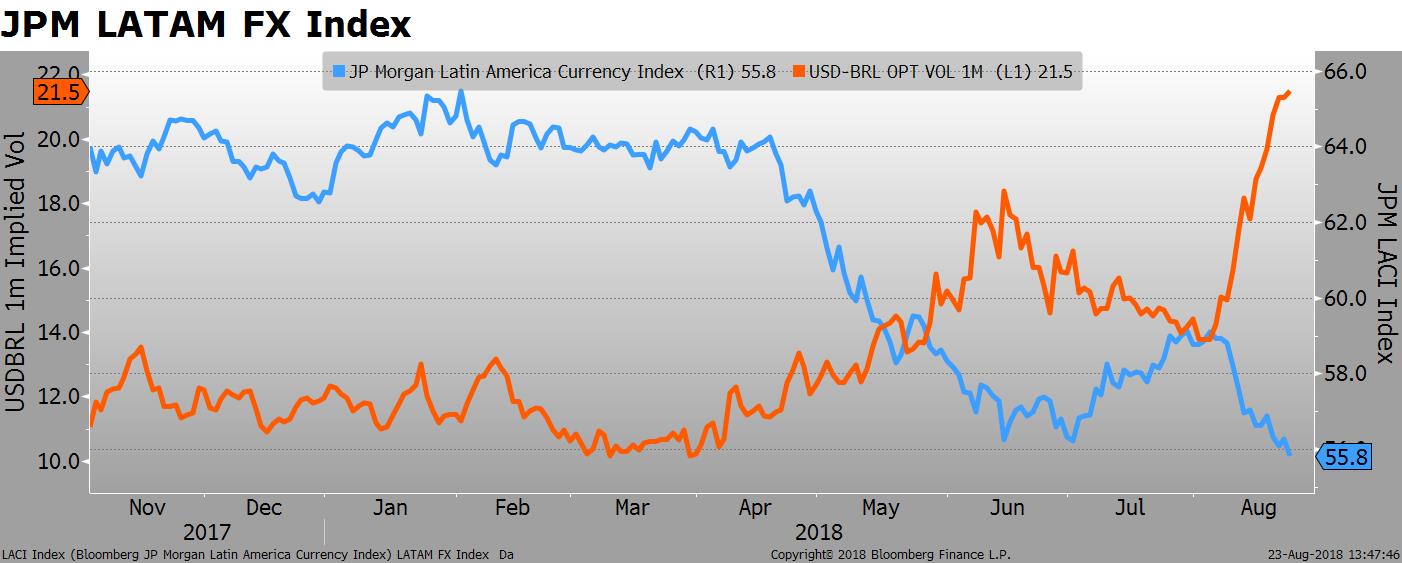
8. Latin America FX Volatility
It was a rough week for Brazilian assets. The currency lost 4.7% of its value versus the USD and the EWZ, the main ETF that tracks the equity market, is off more than 20% YTD. There has not been a positive inflow to the ETF since June.
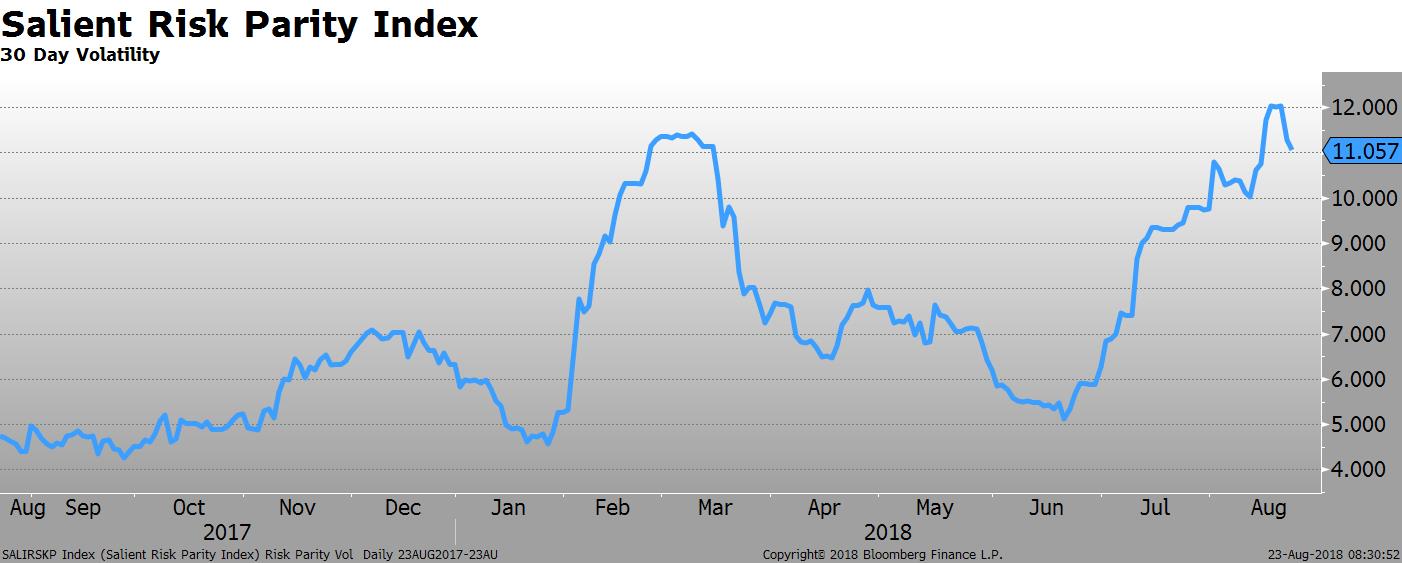
9. Risk Parity Volatility
The Salient Risk Parity Index, which targets a 10% annualized volatility and includes four asset classes (equities, rates, commodities and credit) is down roughly 4.4% YTD. The 30-day realized volatility of the index, interestingly, is near the YTD high.
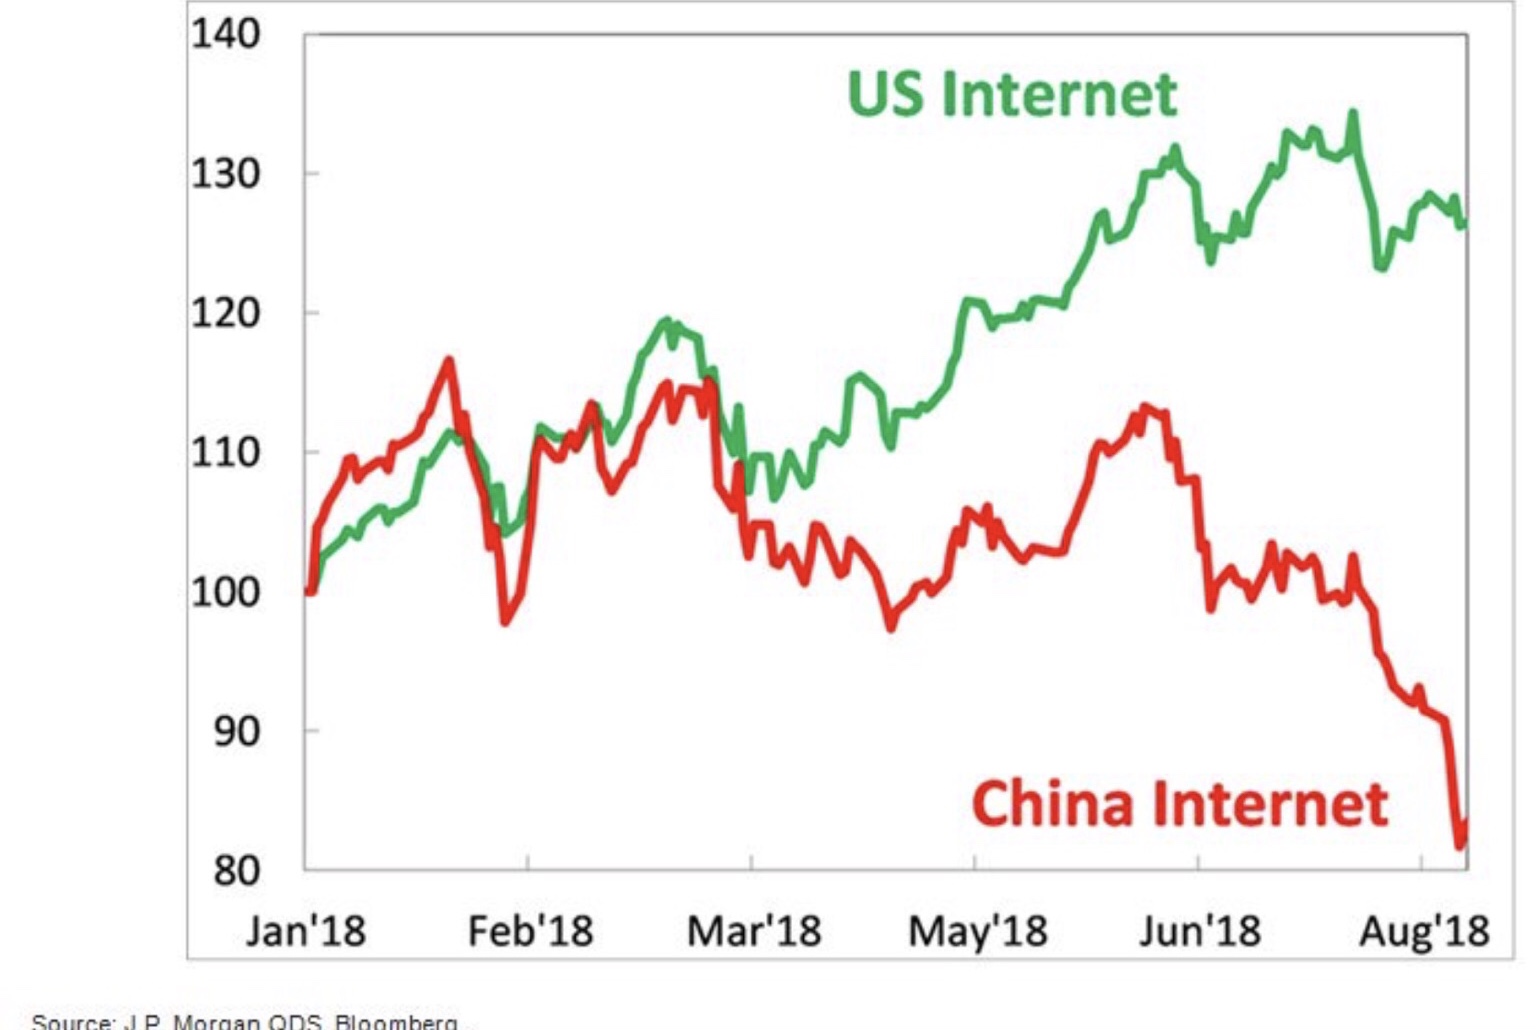
10. Technology Divergence
The tech sector in the US has led the market higher, with internet stocks up roughly 25% so far this year. The internet sector in China, however, is not doing quite as well, where the index is down almost 20% over the same period. Are the internet fundamentals really that different?
Quote of the Week
There are funds that need to be shut, there are funds that need to be consolidated, there are fees that need to be cut and there are funds that need to be started, and there are funds that need to be invented, and there are things that need to be changed.
–Mary Callahan Erdoes, Head, JPM Asset Management