
If you read the front page of the newspaper, you would think global markets are on the verge of a meltdown. An all-out trade war, the division of NATO, the end of globalization– you would expect markets to be in turmoil. Nope. All is quiet on the Western Front. All is quiet in most places, for that matter, with the exception of certain emerging markets.
One can take the view that markets are stupid (which really is just another way to say investors are stupid) or, alternatively, these “major” issues in the 24/7 news cycle are really quite minor. Could it be possible that the long-term impact of incremental tariffs is just not that great? JP Morgan, for example, recently estimated that should the $200B in additional US tariffs on Chinese imports go through, the downward impact on global GDP growth would be 0.25% (although this estimate did not include an impact from the negative knock-on effects on sentiment and investment). Any disruption would be unwelcome, but keep in mind that the IMF increased its forecast for 2018 at the start of the year by 0.2% . If actual global growth was 3.7% vs 3.9%, should equity markets crash? I don’t think so.
The biggest risk to the markets is an unexpected change in monetary policy from any of the major central banks– in either the tightening or easing direction. A major tightening in policy won’t happen unless the outlook for inflation materially changes. There are signs of inflation pressure in pockets of the economy, but the headline figures do not raise alarm bells for the Fed. A surprise move to the dovish side will only happen if the economy slips into a recession– not if it just loses some momentum.
The timing of the next recession is the subject of debate these days, much of it centered around the correlation/causation of a flat yield curve and its ability to predict a recession. The main question is whether QE has distorted the yield curve enough to make things different this time around. Some estimates have the QE impact on the 10Y rate around 50 bp; in other words, 10Y rates would be 50 bp higher without QE. Adjusting for QE, the curve would not be as flat as it is today. There is an argument floating around that a better predictor of a recession would be an inversion of the money market curve and not the 2Y/10Y Treasury curve. Possibly. Even the Fed is weighing in on the topic.
As long as global growth and earnings growth, led by the US and China, remain intact, the market should be able to shrug off the doomsday headlines. There will, of course, be winners and losers from changes in international trade policy at both the country and company levels. So far, though, the broad market is looking past those changes. It’s hard to say the market is not aware of these risks. Investor sentiment, measured by the CNN Money Fear & Greed Index, is signaling more fear than euphoria. Maybe the market is stupid, but it is also quite possible that it is the only thing that can see the forest from the trees.

Now on to some charts.
Economics
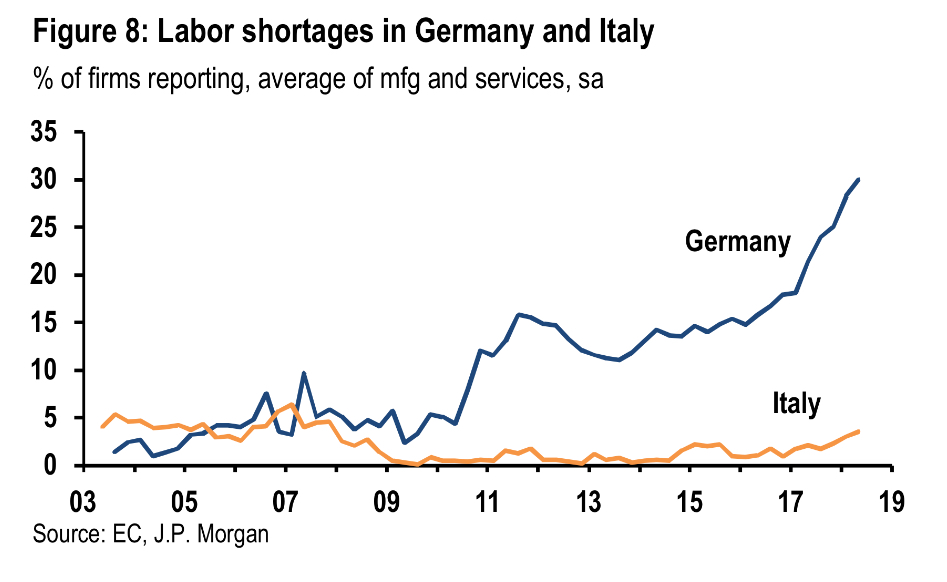 There is a labor shortage in Germany. That is the principle reason behind their pro-immigration policy. They need workers. The same can’t be said for Italy, where much fewer firms are reporting labor shortages and unemployment remains high. The immigration issue is compounded by the geography of the region. The migrant workers show up in Italy, not in Germany. They can’t take a boat directly to central Europe, obviously. Germany’s working population is aging rapidly and it needs new, young workers to fill the void.
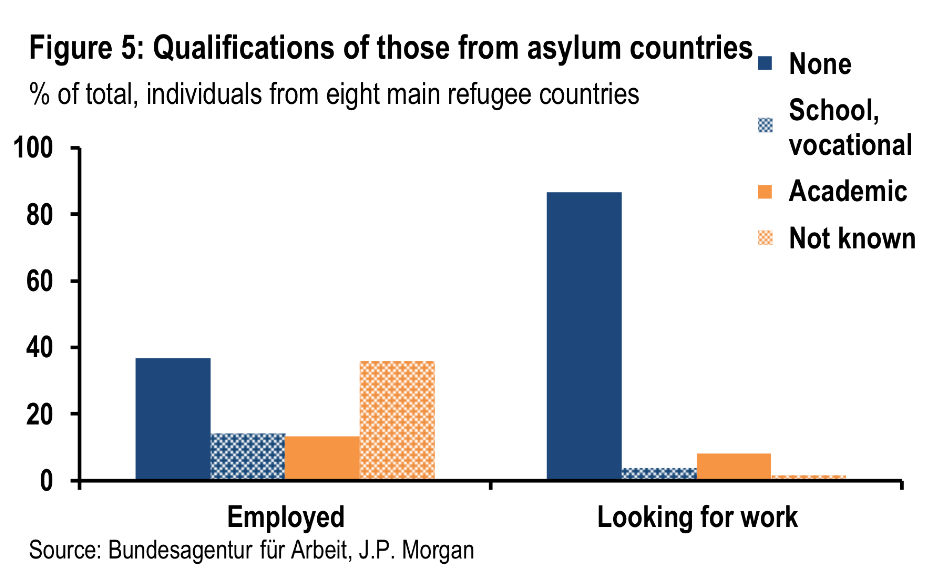
But can new migrants really solve the problem? What about the skill gap between the new laborers and the needs in Germany’s engineering-focussed economy? There is a recognized skill gap, for sure. Indeed, according to some research highlighted in a JP Morgan publication, the migrant workers that have already found jobs in the Eurozone are the ones that have skills. The low-skill/no-skill group is still looking for work. The government plans to deal with that over time.
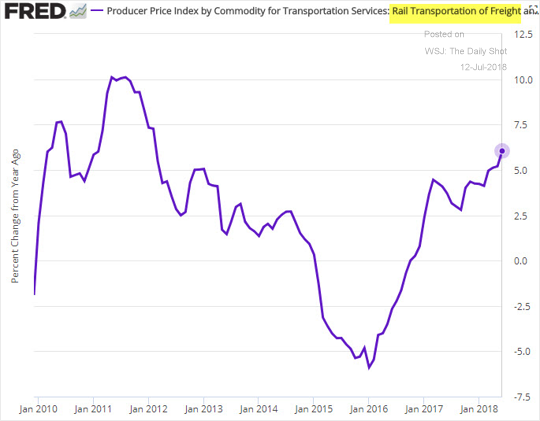
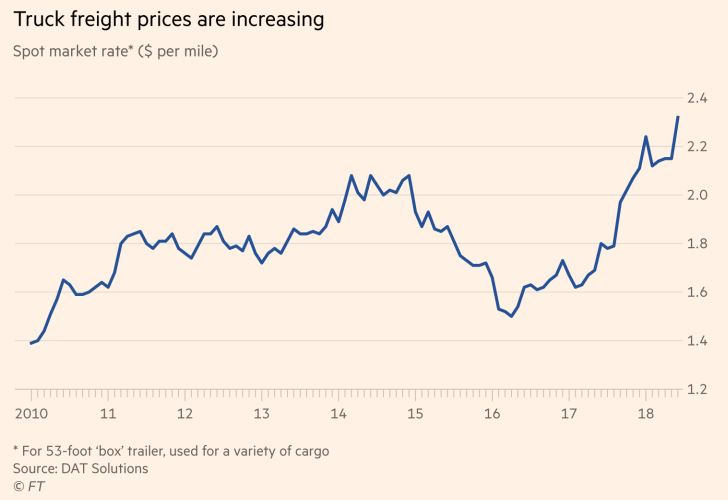
One bottleneck in the US economy is in transportation infrastructure, primarily trucking and rail. A shortage of truck drivers and an increase in demand for rail shipping is causing prices for these services to rise. The higher costs are showing up in the sub-components of the PPI Index. The ability to ultimately pass on the increase to consumers is yet to be determined.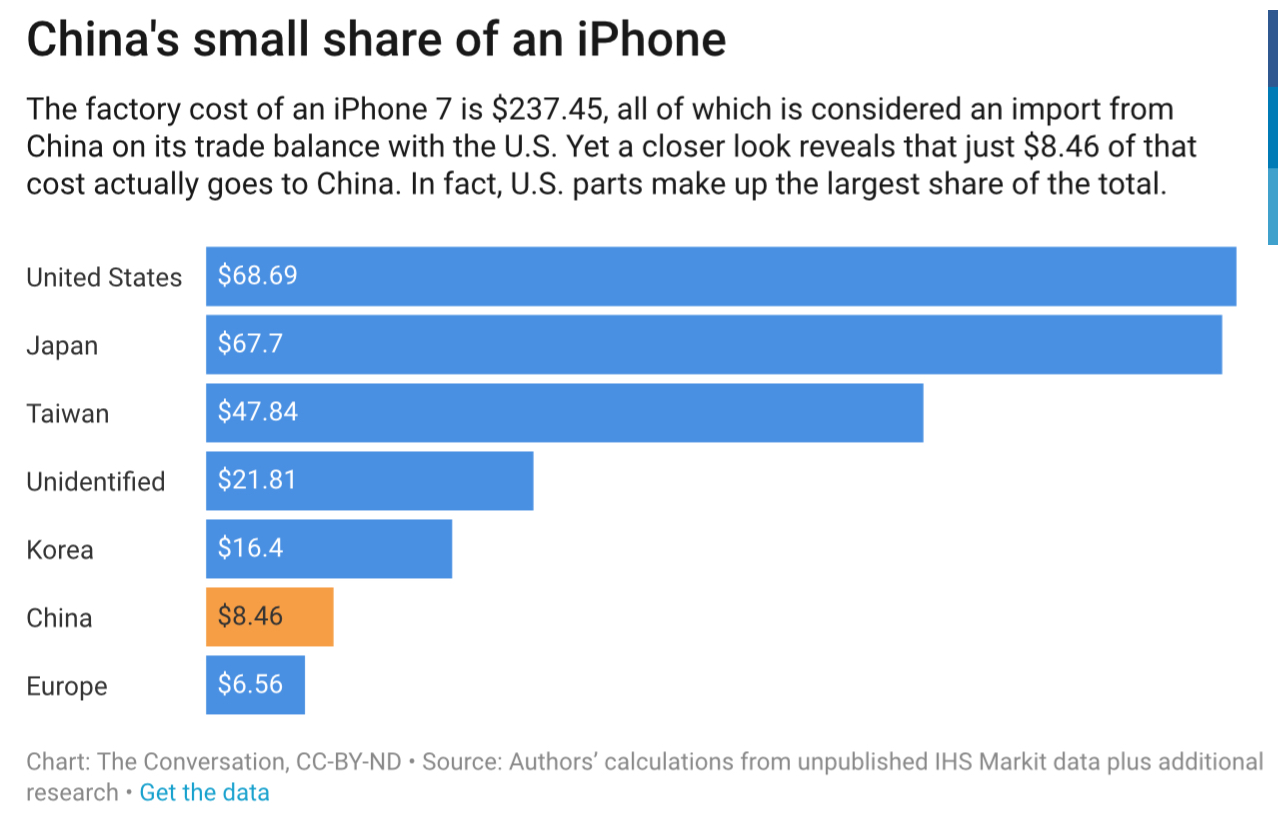
A final word on trade. The US-China deficit is not as meaningful as you might think. A $240 iPhone has only $8.46 of value added from China, yet the $240 shows up as a US import. China does just the assembly for so many products. China is not “getting rich” from exporting. Targeting the trade figure in isolation is a mistake.
Credit
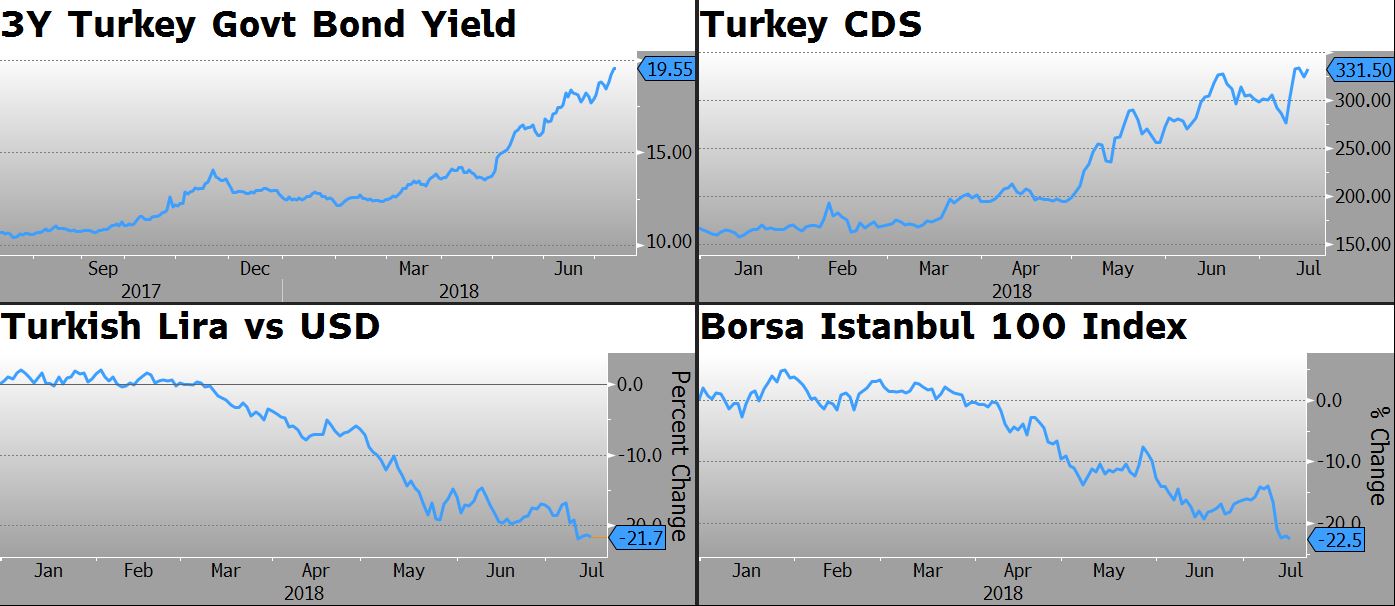 When it comes to the credit markets, most of the action is taking place in emerging market sovereigns. Assets in Turkey are getting hit particularly hard. Stocks, bonds, CDS and the currency are all under extreme pressure. Unfortunately, much of the damage is self-inflicted. The country just re-elected a president that feels compelled to control monetary policy, interfering with the independence of the central bank. Inflation is spiraling out of control, short-term bond yields are approaching 20% and the currency is plummeting. Investors in TUR, the iShares ETF that tracks a basket of Turkish stocks, are nursing losses of 28.4% year to date. But at 6 times price-to-earnings multiple, you might argue that the bad news is already priced into Turkish stocks.
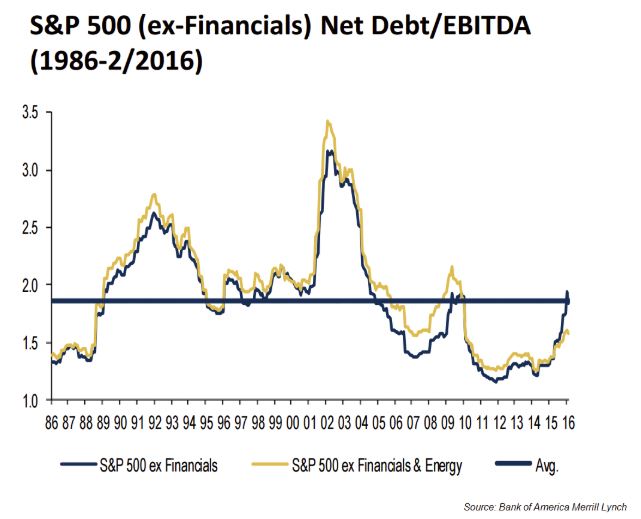
You have probably seen charts like this one before. It shows the average leverage (Debt/EBITDA) of the S&P 500, excluding financials and/or energy companies. Looking at the chart, you might conclude that net leverage is back to pre-financial crisis highs, but still well below the 3x type of levels of 2002. Nothing to panic about, right?
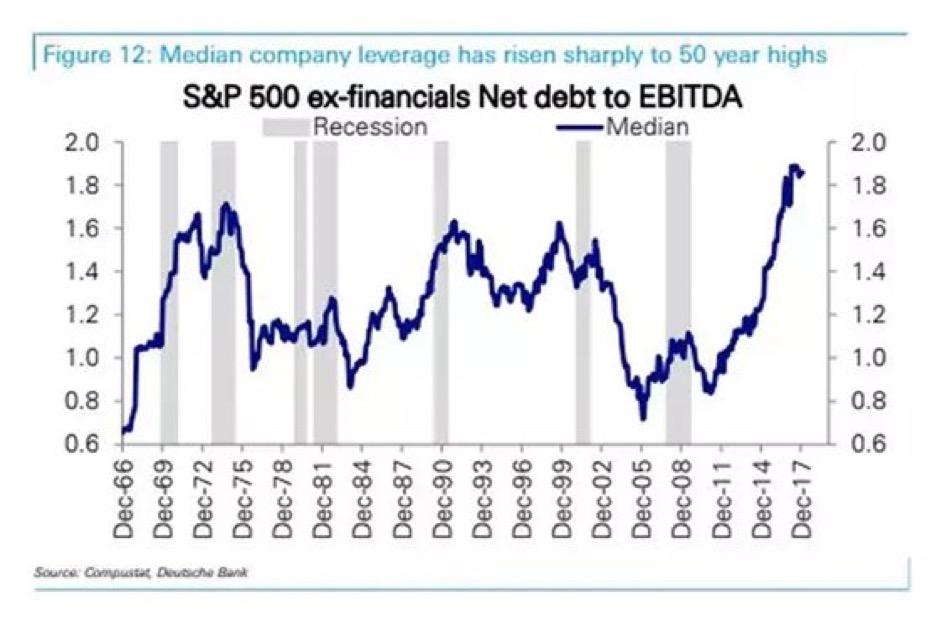
Yet when you look at the median level of leverage, not the average, the picture changes. More companies are at peak leverage today than in 2002. In fact, median company leverage has never been higher. How can you reconcile the difference between the median and the average leverage? It can be explained by looking at the largest companies (ie. the ones with the most weight) in the index. The leverage for the five biggest companies in the S&P 500 is negative.
 The five largest companies in the S&P 500 are all in the technology sector. These companies have billions of dollars in cash and very little debt. Due to their size–they make up more than 15% of the index–they bring down the average Debt/EBITDA figure but do not have a disproportionate effect on the median.
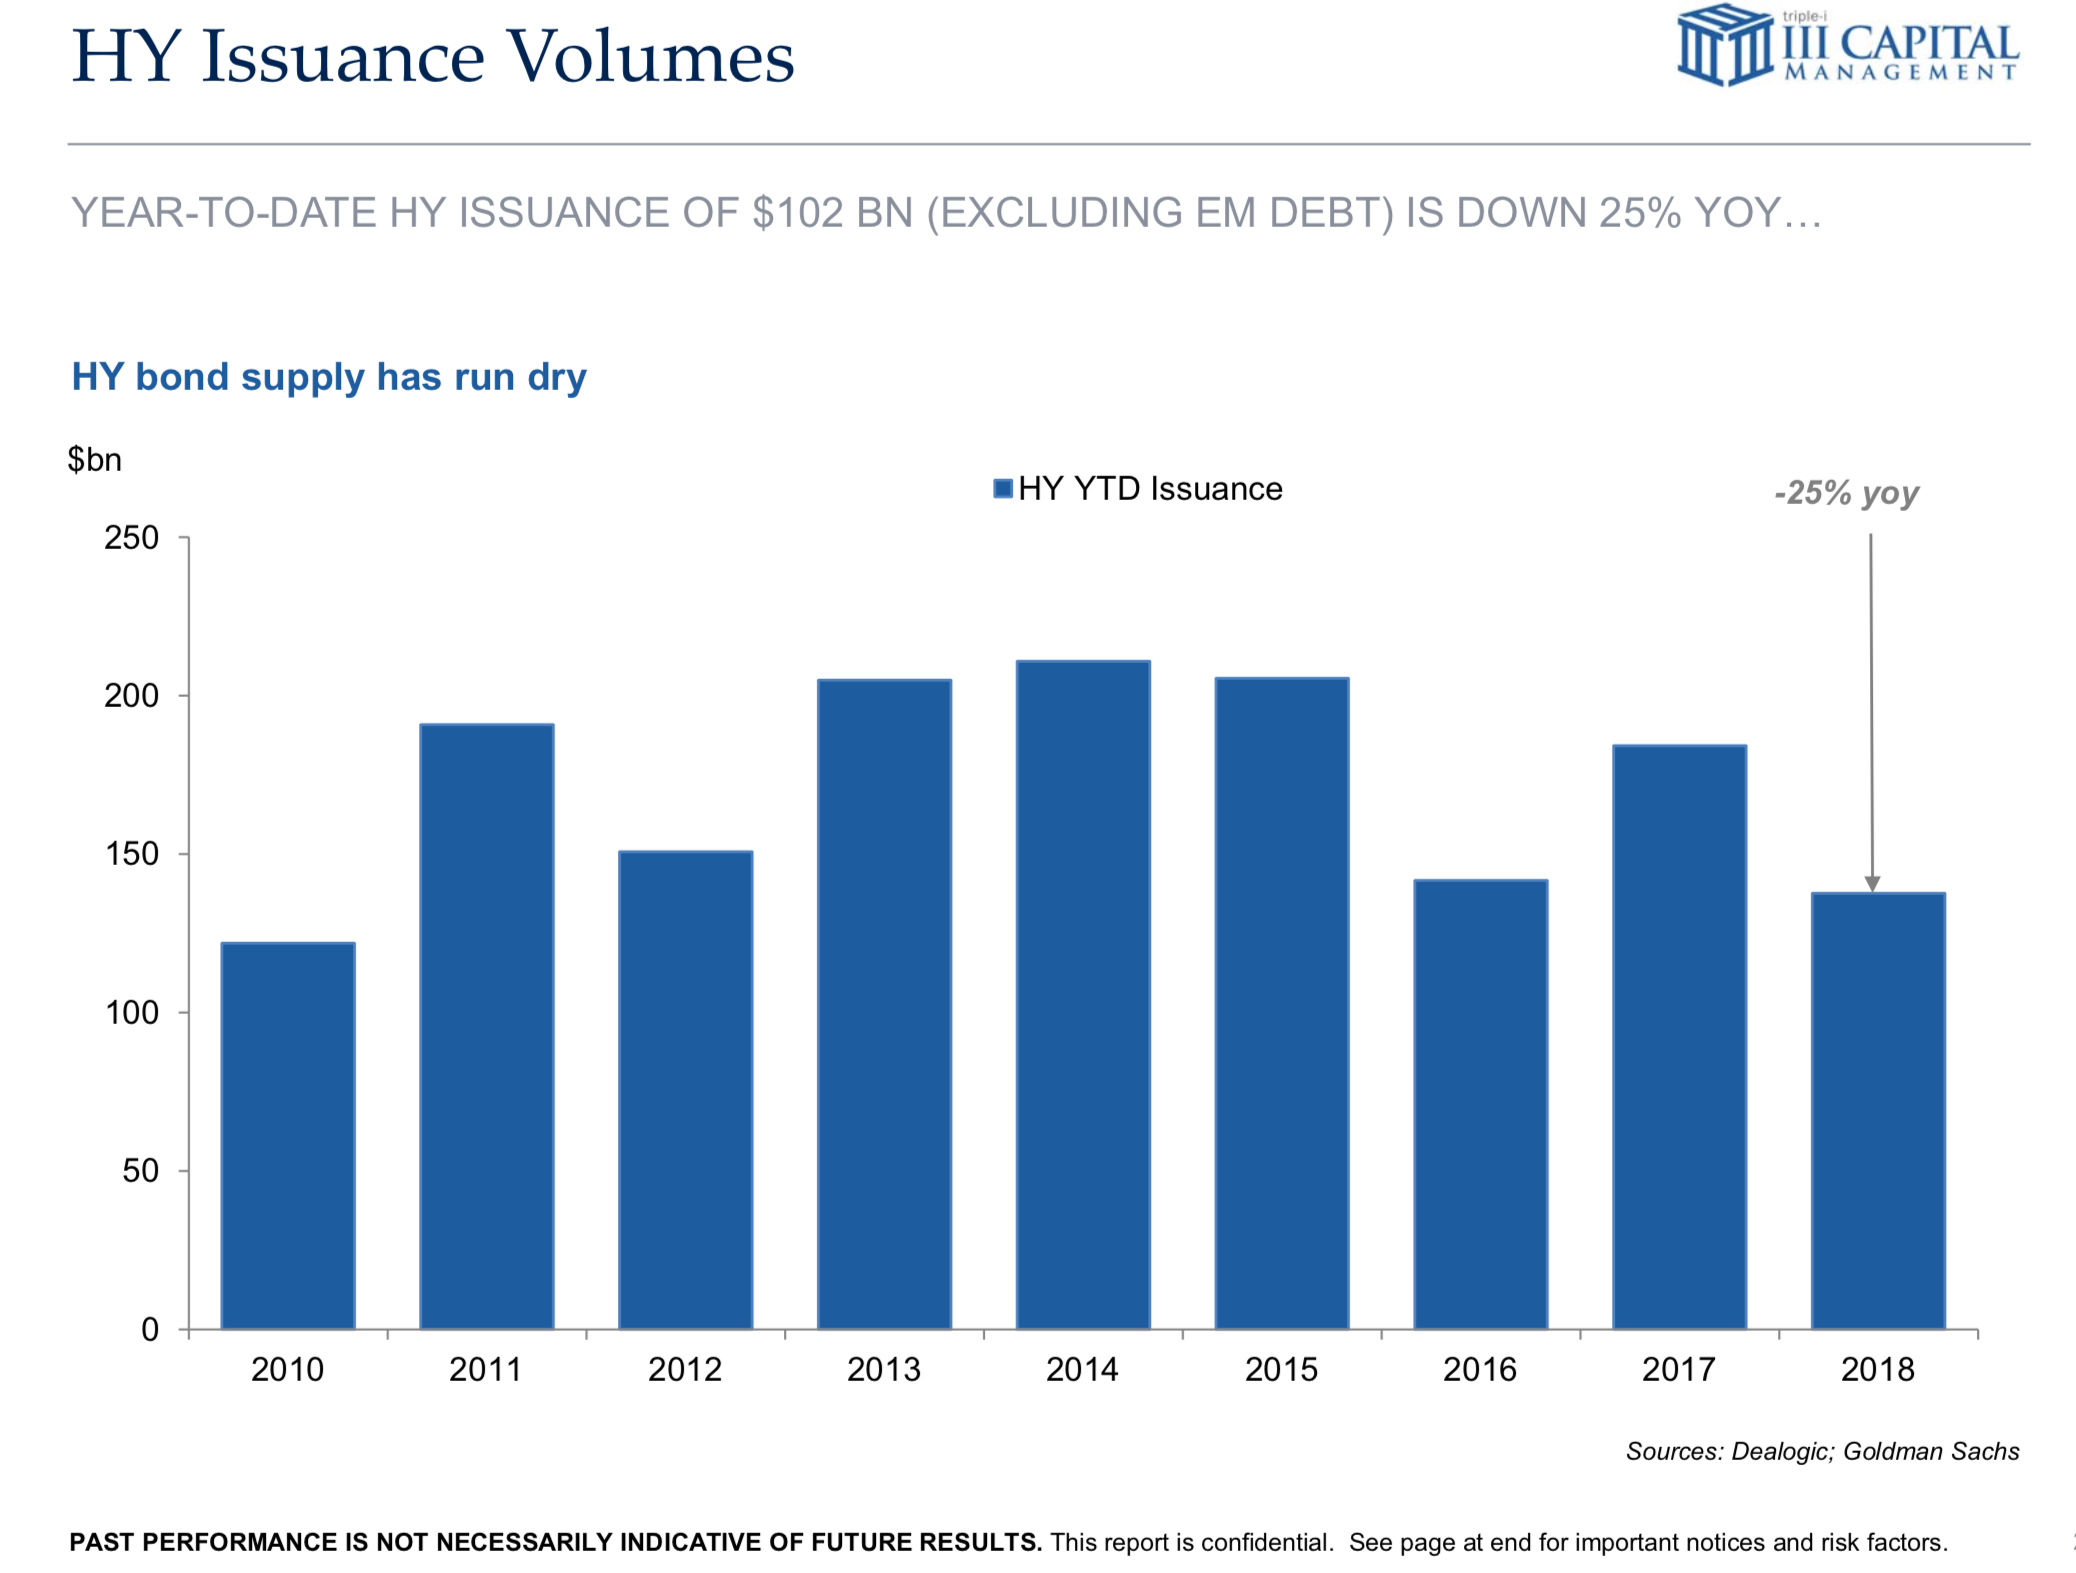
The strength of the US High Yield market has been a surprise to some. Strong corporate earnings is a major factor, but low issuance is probably playing a role, too. Total high yield supply is running 25% below 2017 levels.
Equities

Corporate free cash flow is used for a number of different activities. Much of the cash in the last few years has gone to paying dividends and funding stock buybacks. The current dividend yield for the S&P 500 is 1.9%, but when buybacks are taken into account, the yield of the index jumps to 4.46%. The “buyback yield” is 2.56%.
Should investors consider the combined yield or just the dividend yield when evaluating the “carry” of a market? If all you care about is cash, then just look at the dividend. But the buybacks are real, and they reduce the outstanding share count and hence increase earnings per share. If you hold the price/earnings ratio constant, the price of the stock rises as the share count decreases. Therefore, without taking a view on a change in valuation, the “bump” in stock price to keep the valuation the same should probably be considered part of your carry. It similar to the concept in fixed income where the total return of a bond is comprised of coupon payments plus the change in price due to rolling down the curve.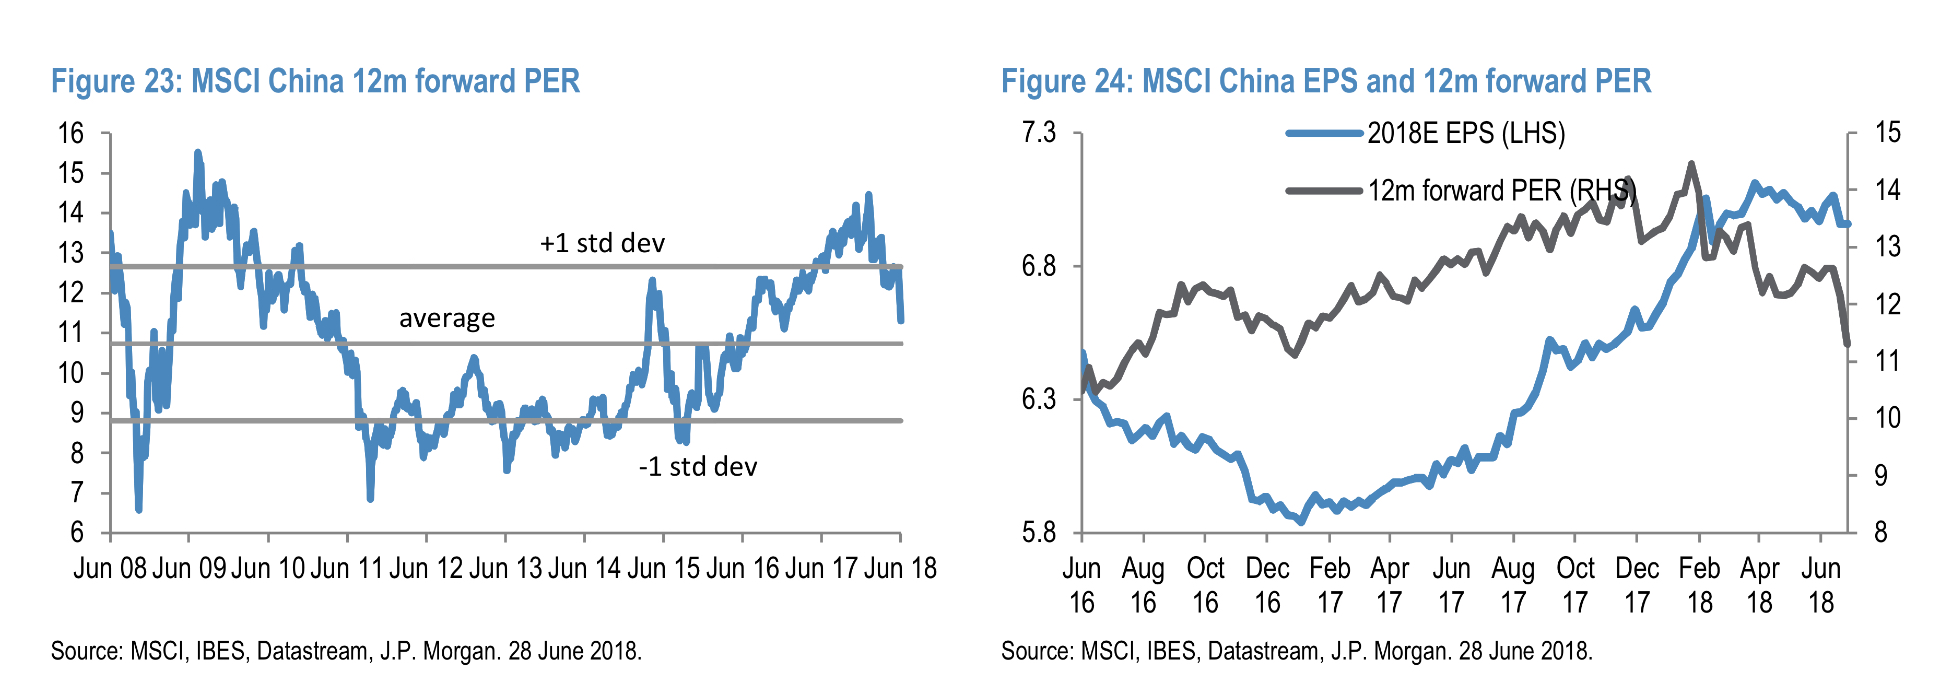
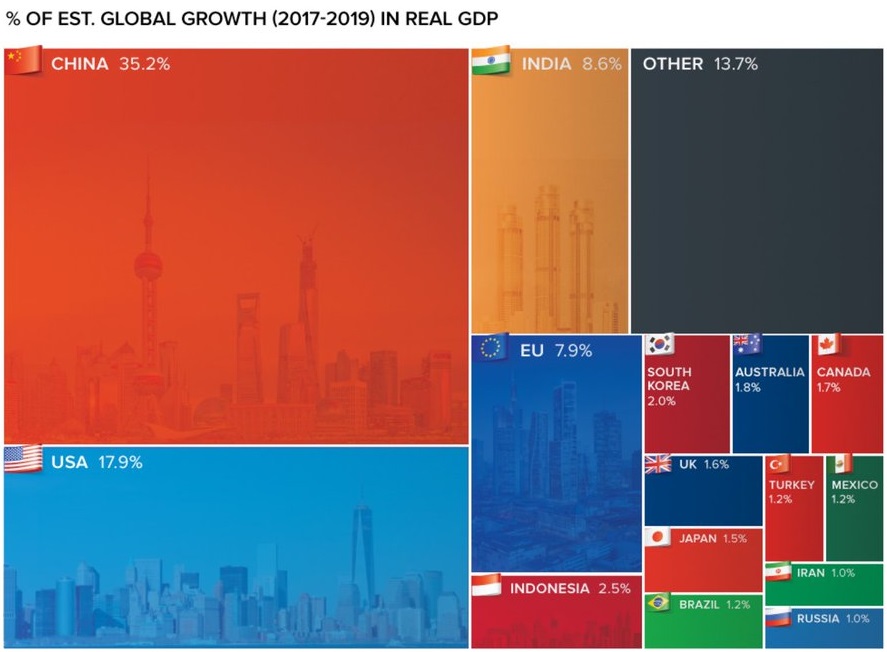
Since China is responsible for 35% of global growth (not global GDP), and Chinese firms make up the largest weighting in most emerging markets indices, it makes sense to keep an eye on potential catalysts for a slowdown. It is also wise to monitor the equity market which is historically prone to large valuation swings.
According to JP Morgan data, the 1-year forward P/E ratio for the MSCI China Index is around 11.5 times earnings, slightly richer than the average over the last 10 years. If there is a catalyst for a major pullback in the Chinese market, it is not from a valuation correction.
Commodities

The shale boom in the Permian basin is impacting more than the Midland/Permian crude price spread (which has been highlighted in previous posts.) It is also driving up housing prices and rents. Rents in Midland, Texas, have almost tripled since 2005 and hotel rooms can cost in excess of $1,000 per night. That’s more than a nice room in Manhattan!
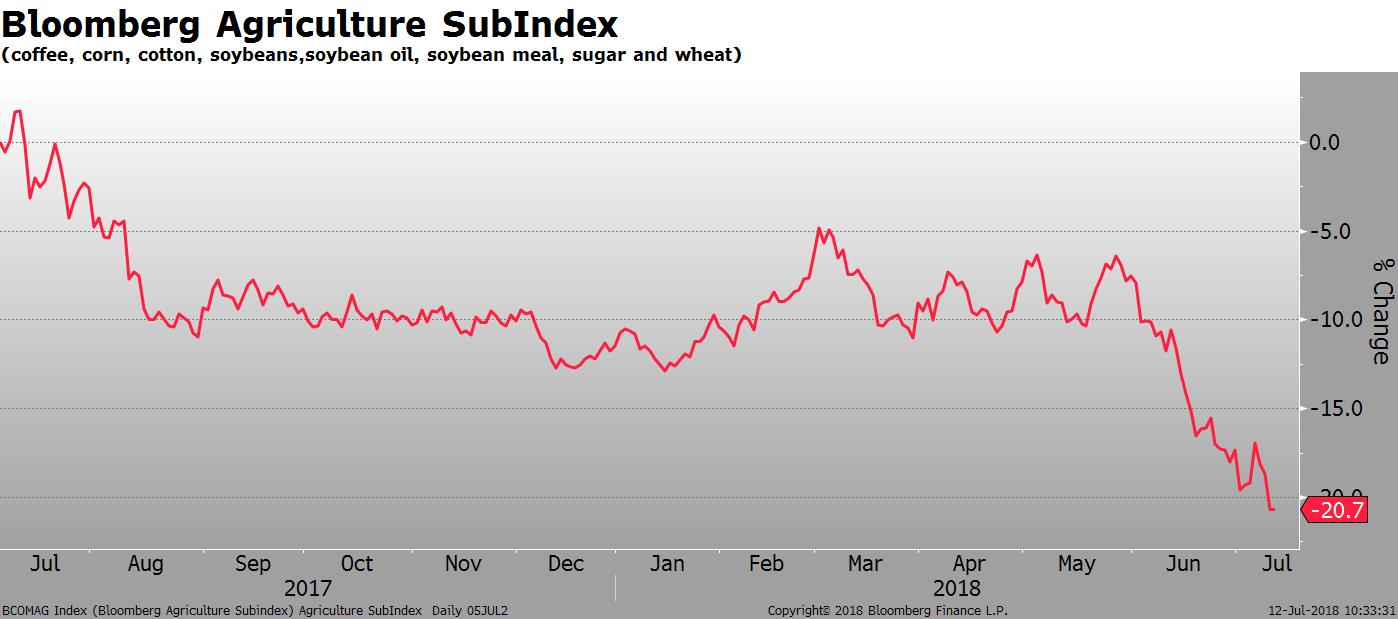
Agricultural products keep hitting new lows. Commodities such as coffee, corn and soybeans are plummeting in price as the fear of a tariff-led international drop in demand rips through the market.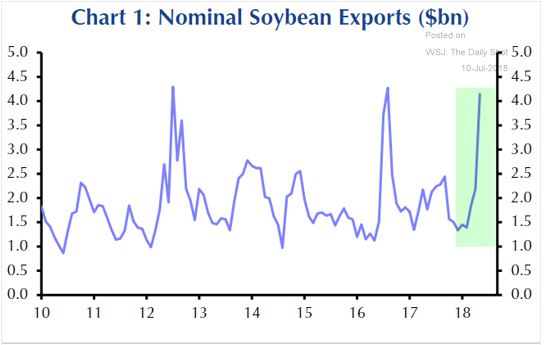
In anticipation of the tariffs, export volumes in some of these commodities are soaring as farmers try to get ahead of any new taxes.
That’s it for today. Thanks for reading.