
Week Ending April 6th
Compared to the equity markets, bond markets around the world were relatively quiet this week. The yield on the US 10-year note closed at 2.83%, up from an intra-week low of 2.74% on Monday when the S&P tested its 200-day moving average. Investors are slowly coming to terms with the change in correlation structure between the two markets: US Treasuries, especially short and intermediate durations, are losing their ability to rally when stocks sink.
The breakdown in the stock-bond relationship has frustrated asset allocators who hold positions in high-grade fixed-income for the diversification benefits (because who would hold negative expected real return bonds for the yield, right?). But there is more to the story than just diverging directions.
The correlation between equity and bond volatility has also shifted. Volatility in one market historically has led to an increase in volatility of the other. The narrative across the business cycle often goes something like this:
When the economy is weak, the slower GDP growth translates into slower profit growth and lower earnings. The Fed responds to the weaker economy by lowering interest rates. Uncertainty over the outlook for both stocks and rates increases the volatility of both asset classes.
That narrative does not apply in today’s market. First, the current downdraft in stocks is not related to the economy: the US and most of the developed and merging world are still enjoying synchronized global growth. Second, the Fed has signaled its plan to continue to raise interest rates 2-3 more times this year. It is going to take a lot more than a 10% peak-to-trough to knock the Fed off its path. The result is a bond market that is more independent from other asset classes than in the past.

The correlation between the VIX and the Merrill Lynch Option Volatility Index (the “MOVE”) has fallen to zero. It has been positive for the last 30 years with the exception of five periods, the last one occurring in 2013.
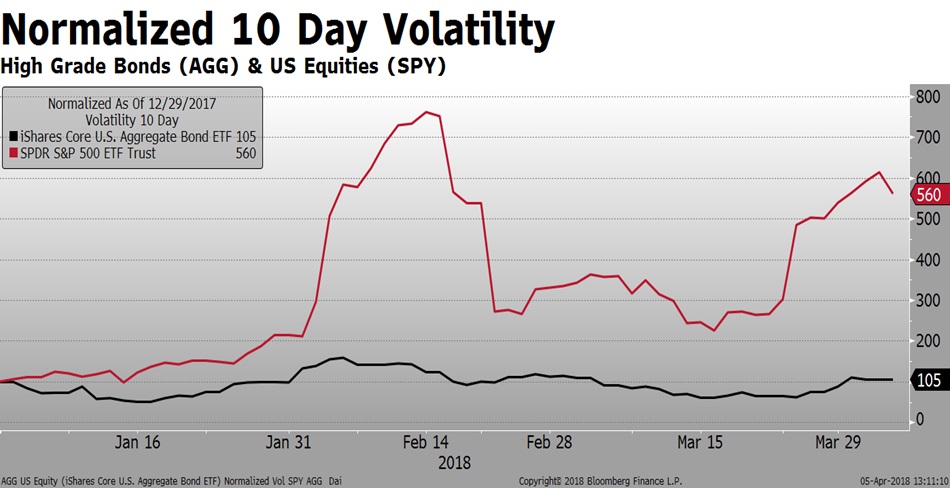
Another way to highlight the outperformance of equity volatility compared to bond volatility is to look at how much each market has moved since the start of the year. The difference is dramatic. 10-day realized volatility on the S&P 500 has risen 560% since the start of the year. High-grade bond volatility is up only 5%. NOBODY predicted that.
So which one, if either, is out of line? The recent stock market volatility is high, and not just compared to the abnormally low realized volatility of 2017. Current 10 day realized at 28% is at the higher end of “normal”. The average over the last 5 years is 11.2%. The Bloomberg/Barclays Aggregate Index, on the other hand, has a current 10 day realized volatility of 3.2%, close to the average level over the last 5 years. As somebody who has followed markets for the last 25 years, I know enough to say that neither is “wrong”. But it sure is odd and hard to explain.

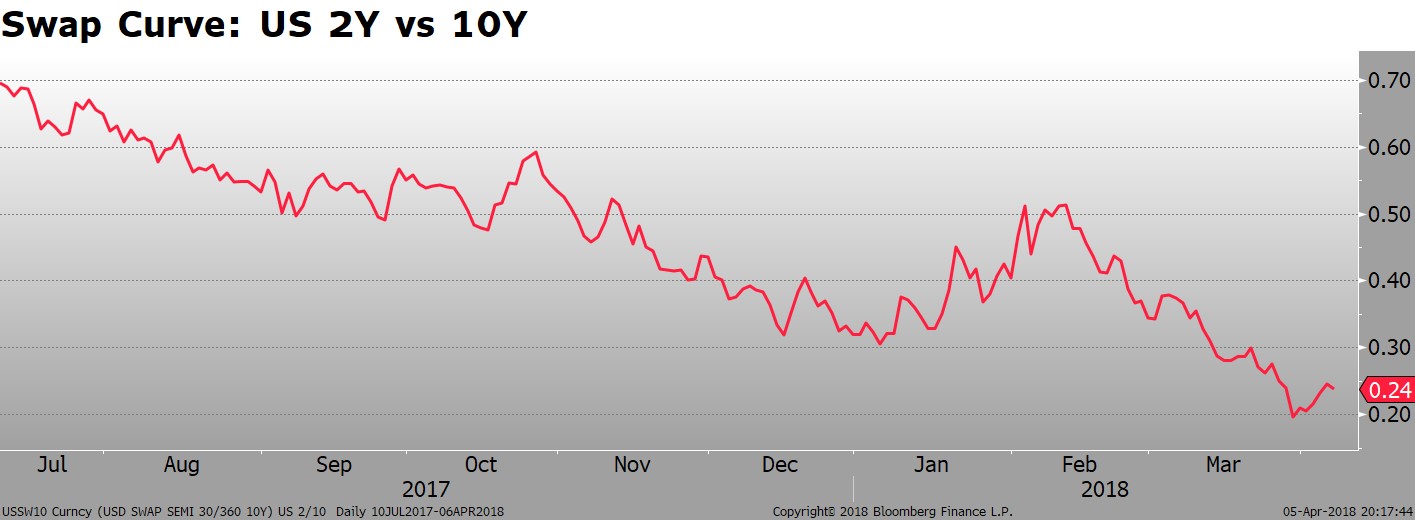
The one relationship which is not hard to explain is the one between 2-year and 10-year rates. The curve flattening of swap curve has been relentless. The pressure is coming from both ends: the front part of the curve is responding to higher LIBOR and the Fed, while the back end is taking its cue from increasing confidence that terminal Fed Funds rate for this cycle is already priced into the curve.
This week, however, the flattening paused. The spread between 10-year and 2-year rates steepened 5 bp. Unless there is a rise in inflation fears, similar to what we saw in January, there does not appear to be a catalyst for the steepening to continue.
In other markets, high yield spreads contracted 10 bp along with the improved sentiment in the stock market, IG spreads narrowed 3 bp, and emerging market sovereign bonds spreads contracted 5 bp.

The stress in the funding market is keeping LIBOR elevated, helping put upward pressure on 1-year and 2-year swap rates. LIBOR/OIS is hovering under 60 bp, up from 10 bp in November of last year. 3-month CP is now trading 49 bp over 3m T-Bills, up from 12 bp over the same period of time. Inflows into the US Treasury for taxes beginning on April 15th should reduce T-Bill issuance and alleviate some of the supply pressure in the money market.
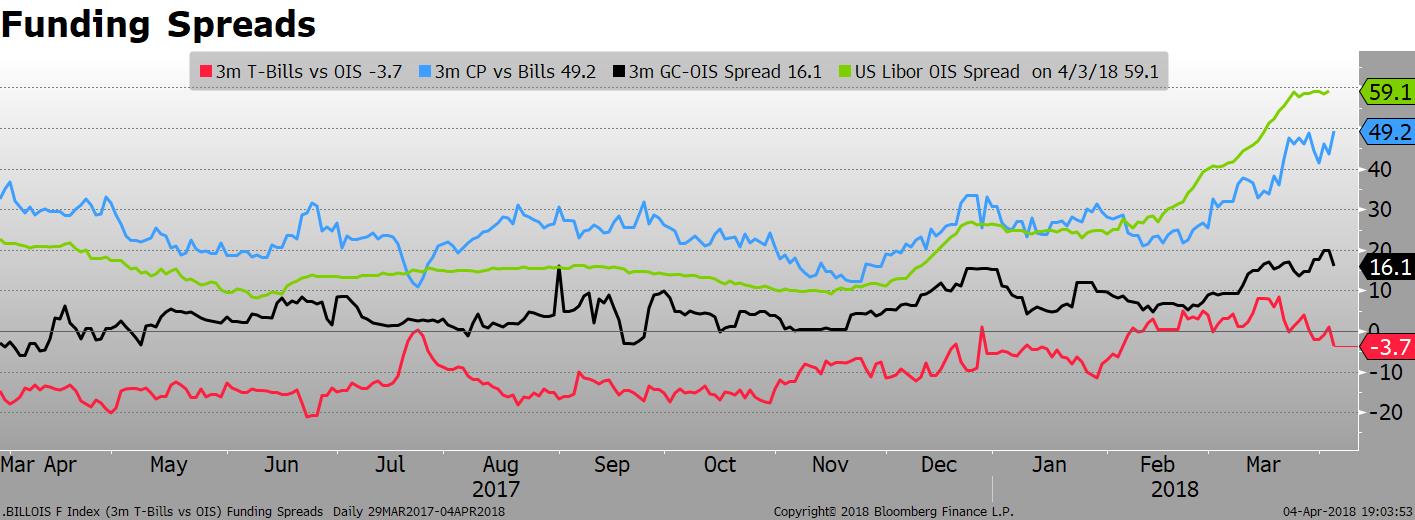
Over the last week, the pressure began to subside. LIBOR/OIS stabilized and T-Bills/OIS and GC/OIS improved slightly.

On the international front, bond markets were equally quiet. With the exception of Greece, which rallied 30 bp in the last week with the prospect of debt relief, 10-year yields in developed markets were all higher.

Yields in most emerging markets were also higher. The 10-year yield in India fell 10 bp in response to expectations for slowing inflation, while yields in Indonesia dropped 16 bp, also reacting to moderating inflation. Brazilian bonds gyrated over the uncertainty surrounding the fate of former President Lula.
Note that this was published BEFORE the release of the April employment report. Levels are from Thursday-Thursday close.
If you would like to subscribe to this blog to get notification of new posts, you can sign up on the main blog page.
That’s all for this week. Over-and-out.
NEWS
Here are some interesting stories relating to fixed income that highlight some of the other issues in the market.
[listly id=”23j9″ layout=”full” per_page=”25″ show_list_headline=”false” show_list_badges=”false” show_list_stats=”false” show_list_title=”false” show_author=”false” show_list_description=”false” show_list_tools=”false” show_item_tabs=”false” show_item_filter=”false” show_item_sort=”false” show_item_layout=”false” show_item_search=”false” show_item_timestamp=”false” show_item_voting=”false” show_item_relist=”false” show_item_comments=”false” show_sharing=”false”]